
Bitcoin approaches Christmas 2025 in a fragile but interesting position. Price trades around the $93,000 area after weeks of pressure. Four key charts show a market late in its correction, yet still lacking a clear bullish trigger.
The data highlights three big forces at work. Recent buyers sit in heavy losses, while new whales are capitulating. Macro conditions still drive price, even as spot buying strength quietly returns.
Short-Term Bitcoin Holders are in Deep Pain
The first chart tracks short-term holder (STH) realized profit and loss. This group includes coins bought in recent months. Their “realized price” is the average cost basis for these coins.
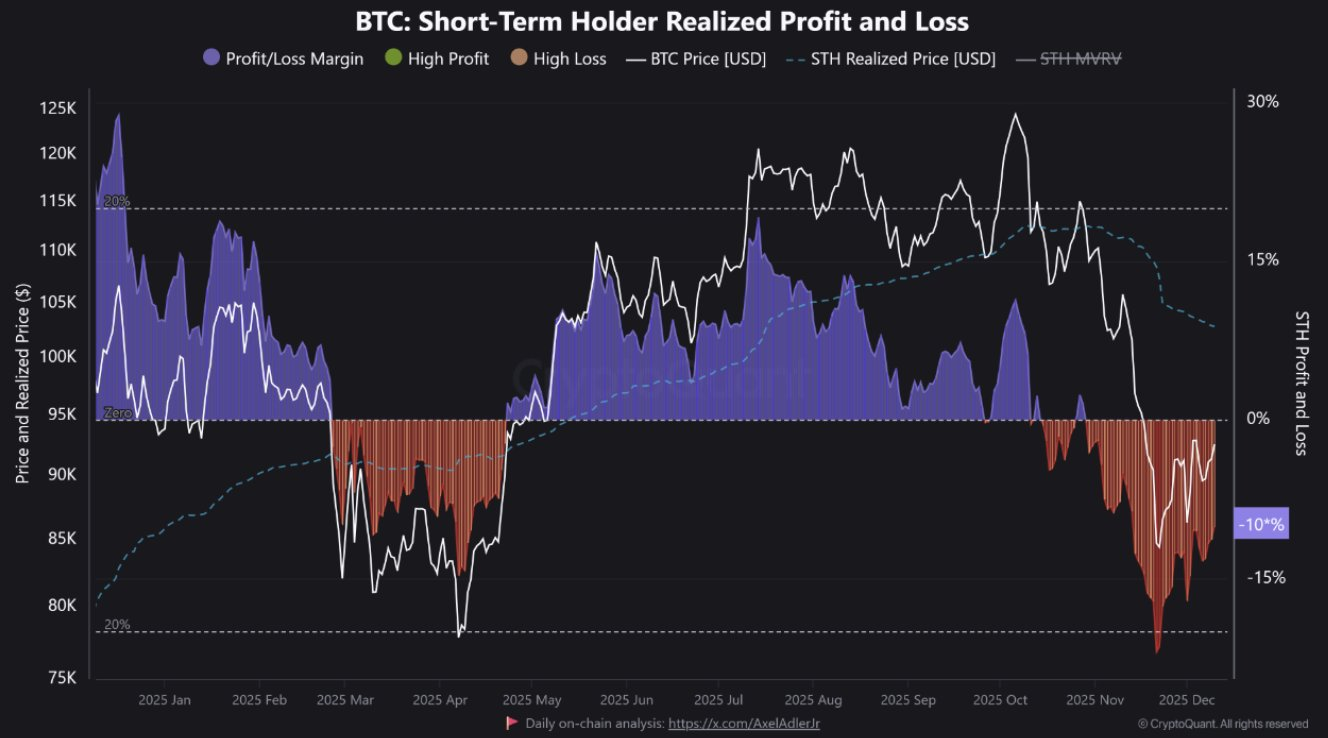 Bitcoin Short-Term Holders Realized Profits and Losses. Source: CryptoQuant
Earlier in 2025, STHs sat on strong gains. Their average position was 15–20% in profit as Bitcoin pushed higher. That phase encouraged profit-taking and added sell pressure near the highs.
Today, the picture has flipped. Bitcoin trades below the STH realized price, and the cohort shows about -10% losses. The histogram on the chart is red, marking one of the deepest loss regimes of 2025.
This has two consequences.
Near term, these underwater holders can sell into every bounce. Many simply want out at break-even, which caps rallies toward their entry zone.
However, deep and persistent loss pockets usually appear later in corrections. They signal that weak hands already took heavy damage.
At some point, the selling power of this group runs low.
Historically, the key turning signal comes when price reclaims the STH realized price from below. That move tells you forced selling is mostly done and new demand absorbs supply.
Until that happens, the chart still argues for caution and range trading around current levels.
New Bitcoin Whales Just Surrendered
The second chart shows realized profit and loss by whale cohorts. It splits flows between “new whales” and “old whales”. New whales are large holders that accumulated recently.
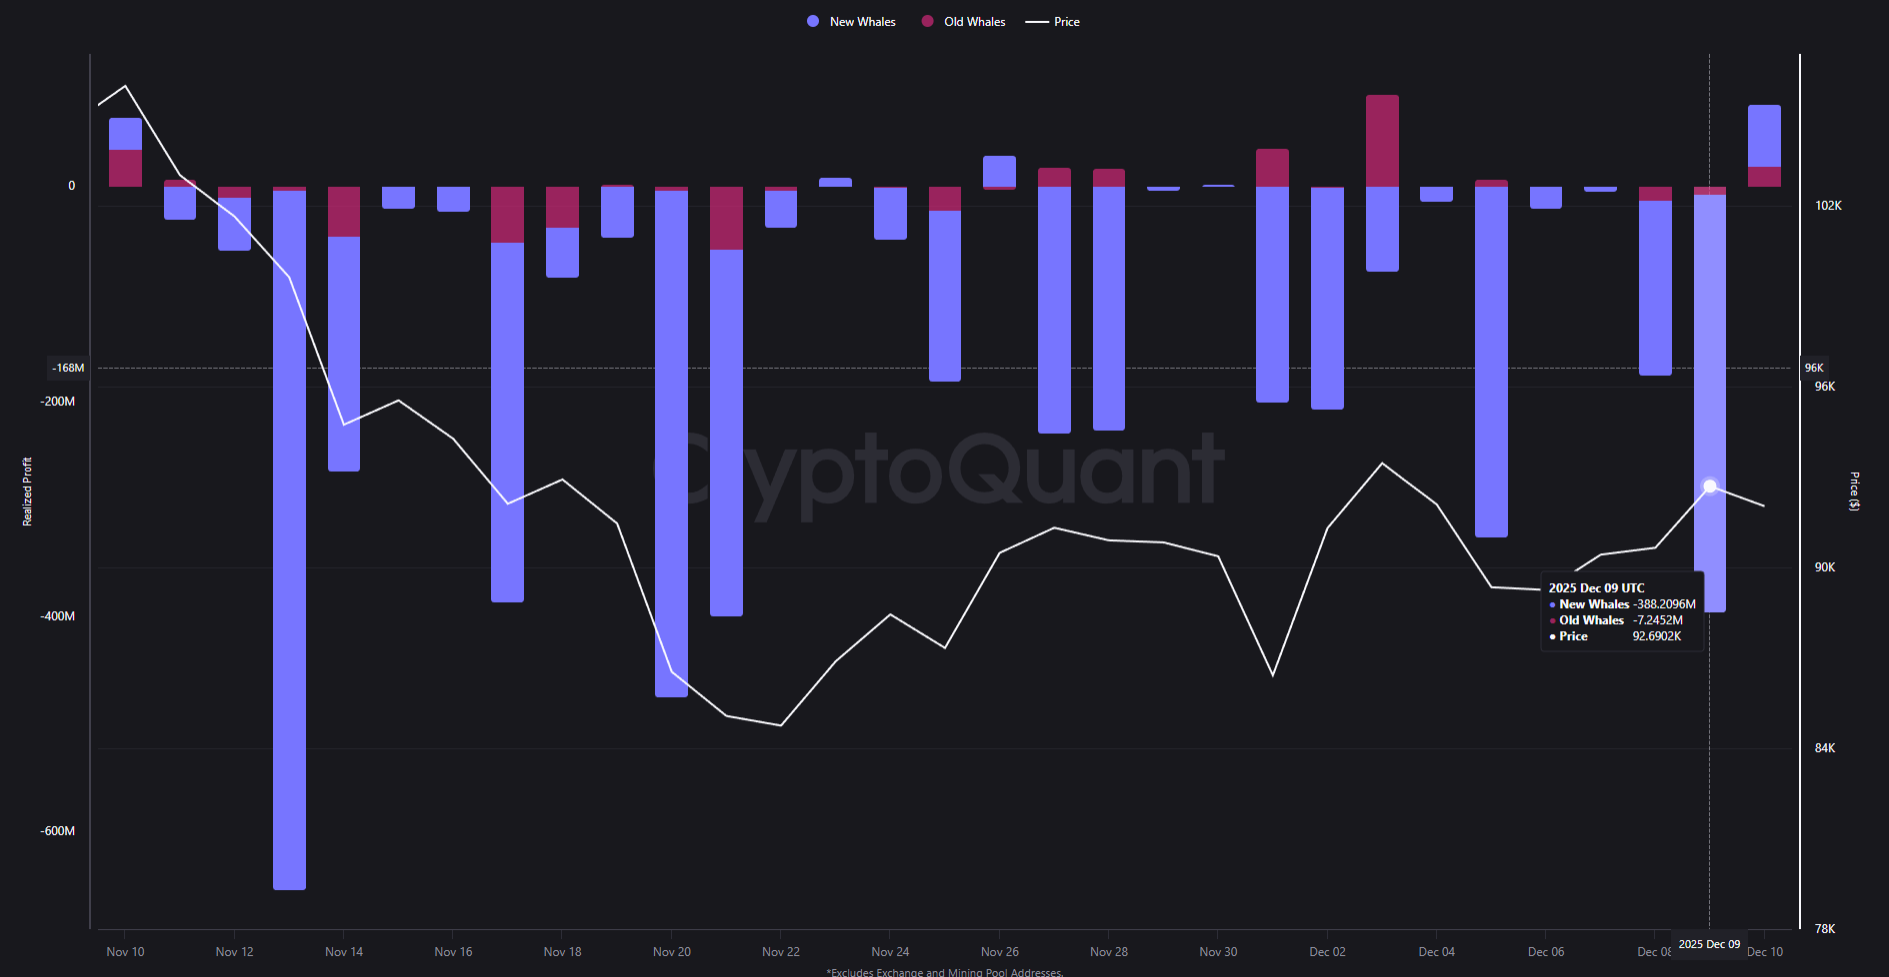 Realized Profits by Bitcoin Whales Since November 2025. Source: CryptoQuant
Yesterday, new whales realized $386 million in losses in one day. Their bar on the chart is a large negative spike. Several other big negative bars cluster around recent lows.
Old whales tell a different story. Their realized losses and profits are smaller and more balanced. They are not exiting at the same pace as the newcomers.
This pattern is typical at late stages of a correction. New whales often buy late, sometimes with leverage or strong narrative bias. When price moves against them, they are first to capitulate.
That capitulation has a structural benefit. Coins move from weak large hands to stronger hands or smaller buyers. Future sell-side overhang from this group decreases after such events.
Short term, these flushes can still drag price lower. Yet medium term, they improve the quality of Bitcoin’s holder base.
The market becomes more resilient once panicked large sellers finish exiting.
Real Interest Rates Still Steer Bitcoin
The third chart overlays Bitcoin with two-year US real yields, inverted. Real yields measure interest rates after inflation. The series moves almost tick-for-tick with BTC across 2025.
When real yields fall, the inverted line rises. Bitcoin tends to rise alongside it as liquidity improves. Lower real yields make risk assets more appealing relative to safe bonds.
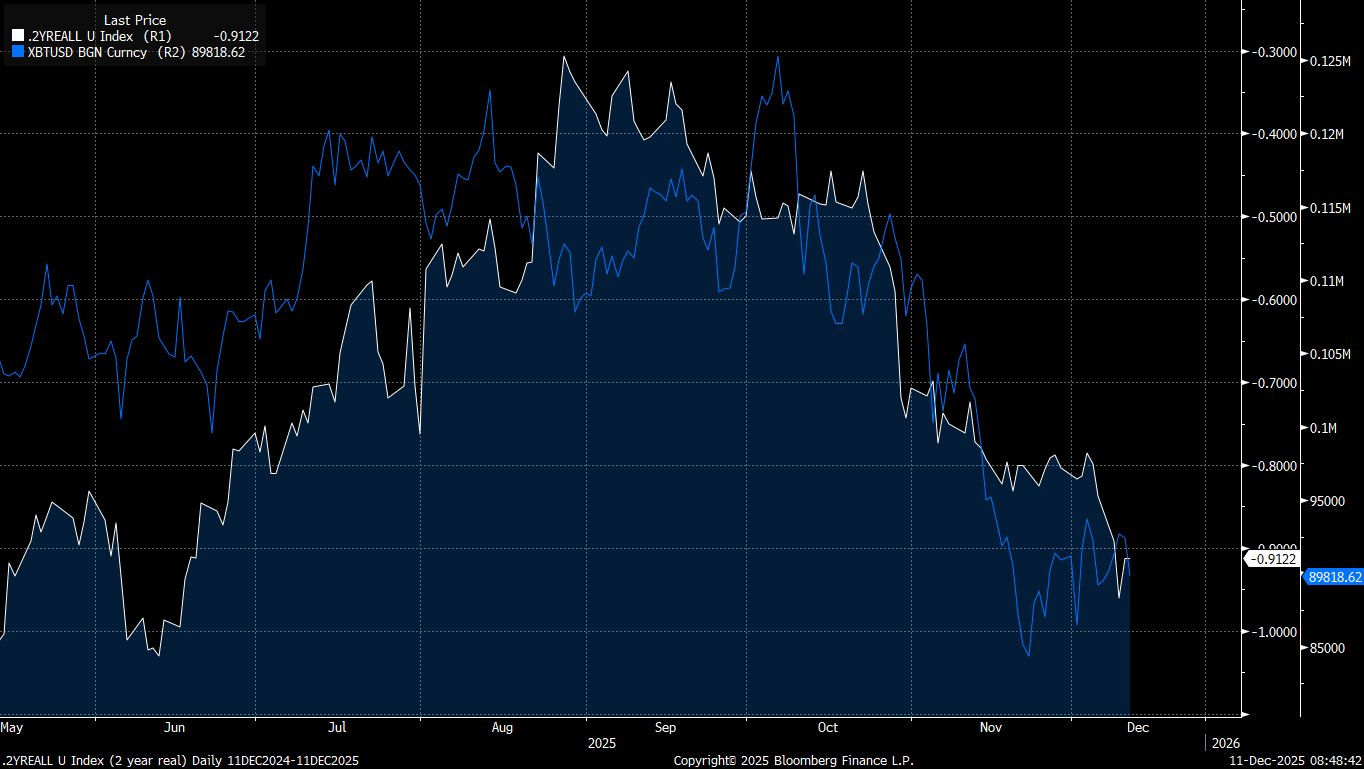 2-Year Real Interest Rates Inverted With BTC Overlaid
Since late summer, real yields have moved higher again. The inverted line trended lower, and Bitcoin followed it down. This shows macro conditions still dominate the larger trend.
Federal Reserve rate cuts alone may not fix this. What matters is how markets expect real borrowing costs to evolve. If inflation expectations fall faster than nominal rates, real yields can even rise.
For Bitcoin, a durable new bull leg likely needs easier real conditions. Until bond markets price that shift, BTC rallies face a macro headwind.
Spot Taker Buyers are Stepping Back In
The fourth chart tracks 90-day Spot Taker CVD across major exchanges. CVD measures the net volume of market orders that cross the spread.
It shows whether aggressive buyers or sellers dominate.
For weeks during the drawdown, the regime was Taker Sell Dominant. Red bars filled the chart as sellers hit bids across spot markets. This aligned with the grinding drift lower in price.
Now the signal has flipped. The metric just turned Taker Buy Dominant, with green bars returning. Aggressive buyers now outnumber aggressive sellers on spot venues.
This is an early but important change. Trend reversals often start with microstructure shifts like this.
First buyers step in, then price stabilizes, then larger flows follow.
One day of data is never enough. However, a sustained green regime would confirm that real demand is back. It would show spot markets absorbing supply from STHs and capitulating whales.
What It All Means For Bitcoin Price Heading Into Christmas
Taken together, the four charts show a late-stage correction, not a fresh bull market.
Short-term holders and new whales carry heavy losses and still sell into strength. Macro real yields keep a lid on risk appetite at the index level.
At the same time, some building blocks for a recovery are visible. Capitulation by new whales cleans up the holder base.
Spot taker buyers are returning, which reduces downside velocity.
Heading into Christmas 2025, Bitcoin looks range-bound with a bearish tilt, hovering around $90,000.
Downside spikes into the mid or high-$80,000s remain possible if real yields stay high. A clear bullish shift likely needs three signals together:
First, price must reclaim the short-term holders’ realized price and hold above it. Second, two-year real yields should roll lower, easing financial conditions.
Third, Taker Buy dominance should persist, confirming strong spot demand.
Until that alignment appears, traders face a choppy market shaped by macro data and trapped holders. Long-term investors may see this as a planning zone rather than a time for aggressive bets.
The post 4 Charts Explain Bitcoin’s Price Condition Heading into Christmas 2025 appeared first on BeInCrypto.


 24h Most Popular


 Utilities