
November 2025 is witnessing a heavy wave of selling pressure on Bitcoin (BTC ($91,092.00)). This pressure has pushed the world’s largest cryptocurrency below $90,000 and wiped out all gains accumulated this year. The question now is whether the selling will ease soon.
If it continues, several support levels may offer opportunities. The following analysis breaks down the details.
Why Bitcoin’s Decline May Not Be Over
Data from CryptoQuant shows that Binance Exchange Netflow recently recorded daily inflows exceeding 6,000 BTC in October, the highest level in a month.
The chart also shows that most days recorded positive netflows, meaning inflows exceeded outflows. This pattern reflects a growing tendency to move BTC onto exchanges for selling, driven by fears of further price declines.
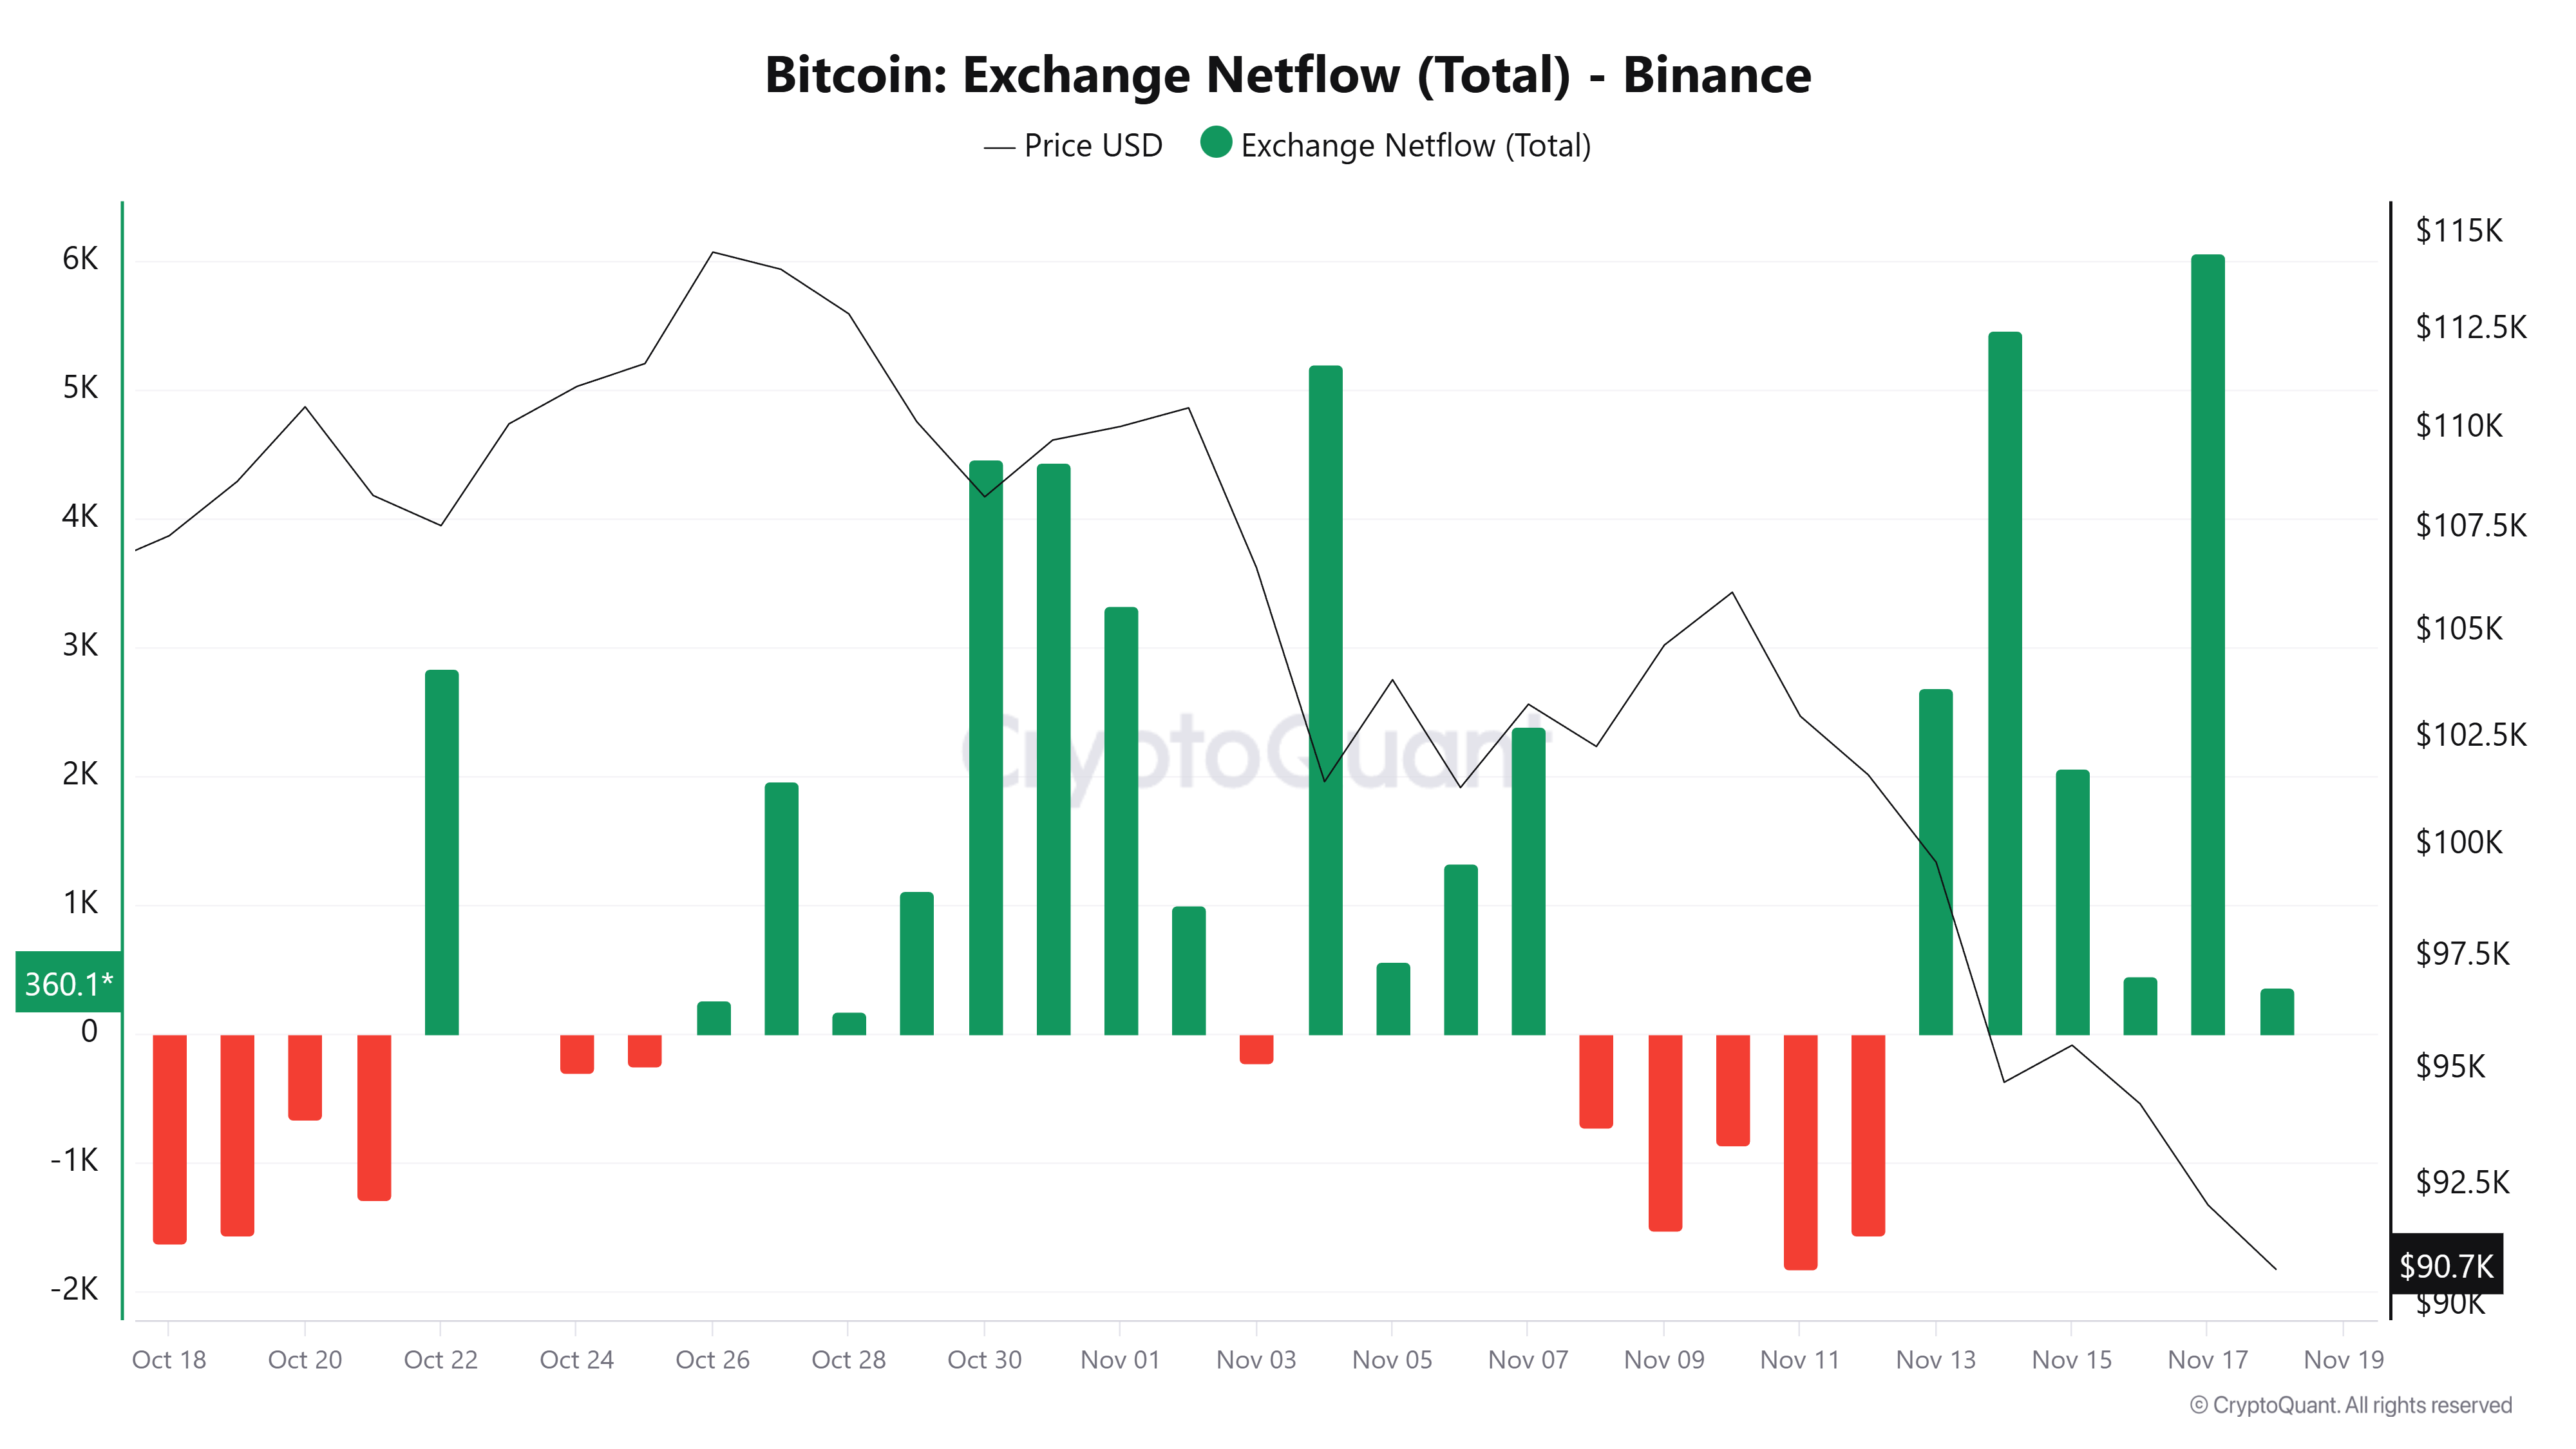 Bitcoin Exchange Netflow – Binance. Source: CryptoQuant.
This sentiment has pushed Bitcoin reserves on exchanges higher in November, adding even more selling pressure this month.
Specifically, Bitcoin reserves on Binance— the exchange with the highest BTC liquidity — rose from 540,000 BTC last month to more than 582,000 BTC in November.
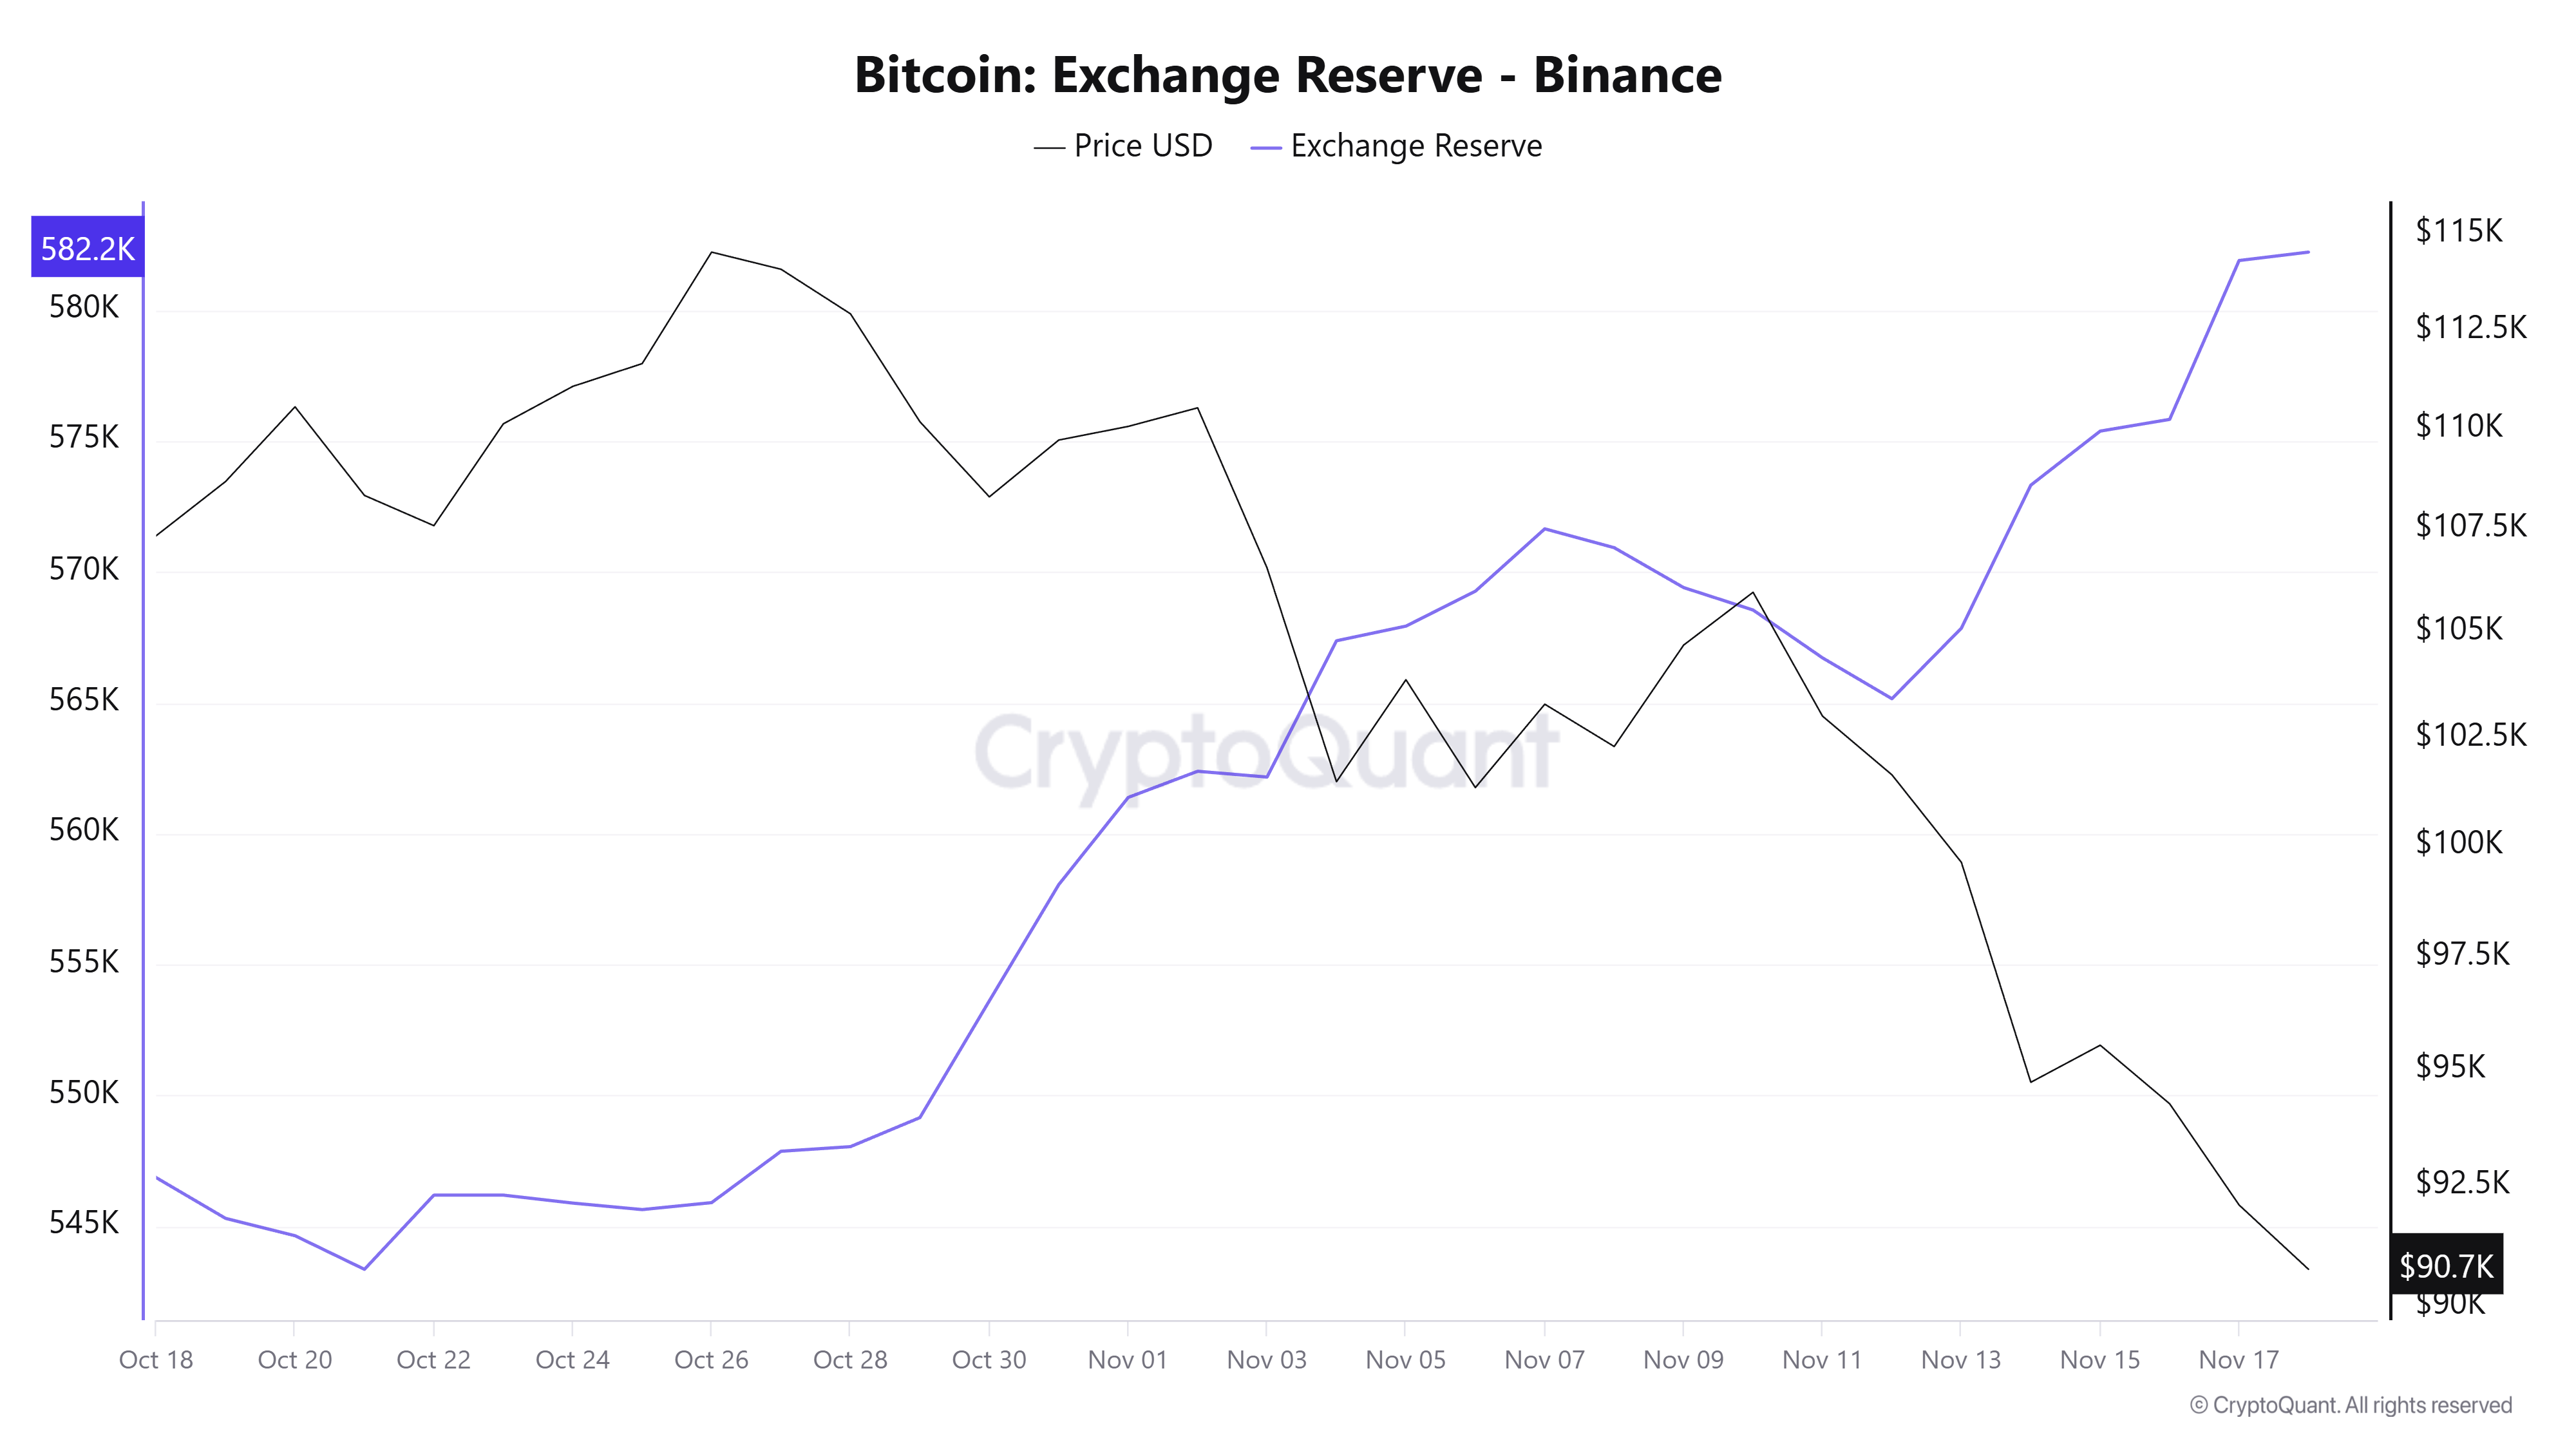 Bitcoin Exchange Reserve – Binance. Source: CryptoQuant.
This trend, combined with selling pressure from BTC ETFs in November, has raised concerns among analysts that the downturn may continue.
“Selling pressure is increasing while demand remains weak. A true market bottom usually shows strong demand inflows — but current on-chain data, such as market buy volume and other demand indicators, do not yet signal a bottom. Caution is advised, as further downside remains likely,” analyst CoinDream commented.
3 Support Levels to Watch
In this context, Joao Wedson — founder of Alphractal — highlighted two important support levels to monitor if BTC closes below $92,000.
- The first is the Active Realized Price at $89,400, which represents the realized value of all BTC based on on-chain activity. This level served as strong support in previous cycles.
- The second is the True Market Mean Price at $82,400, representing the true average of the market, where the price found a perfect equilibrium in July 2021.
In a worst-case scenario, if a genuine bear market begins, BTC could slide toward $45,500. This estimate is based on the Cumulative Value Days Destroyed (CVDD) model.
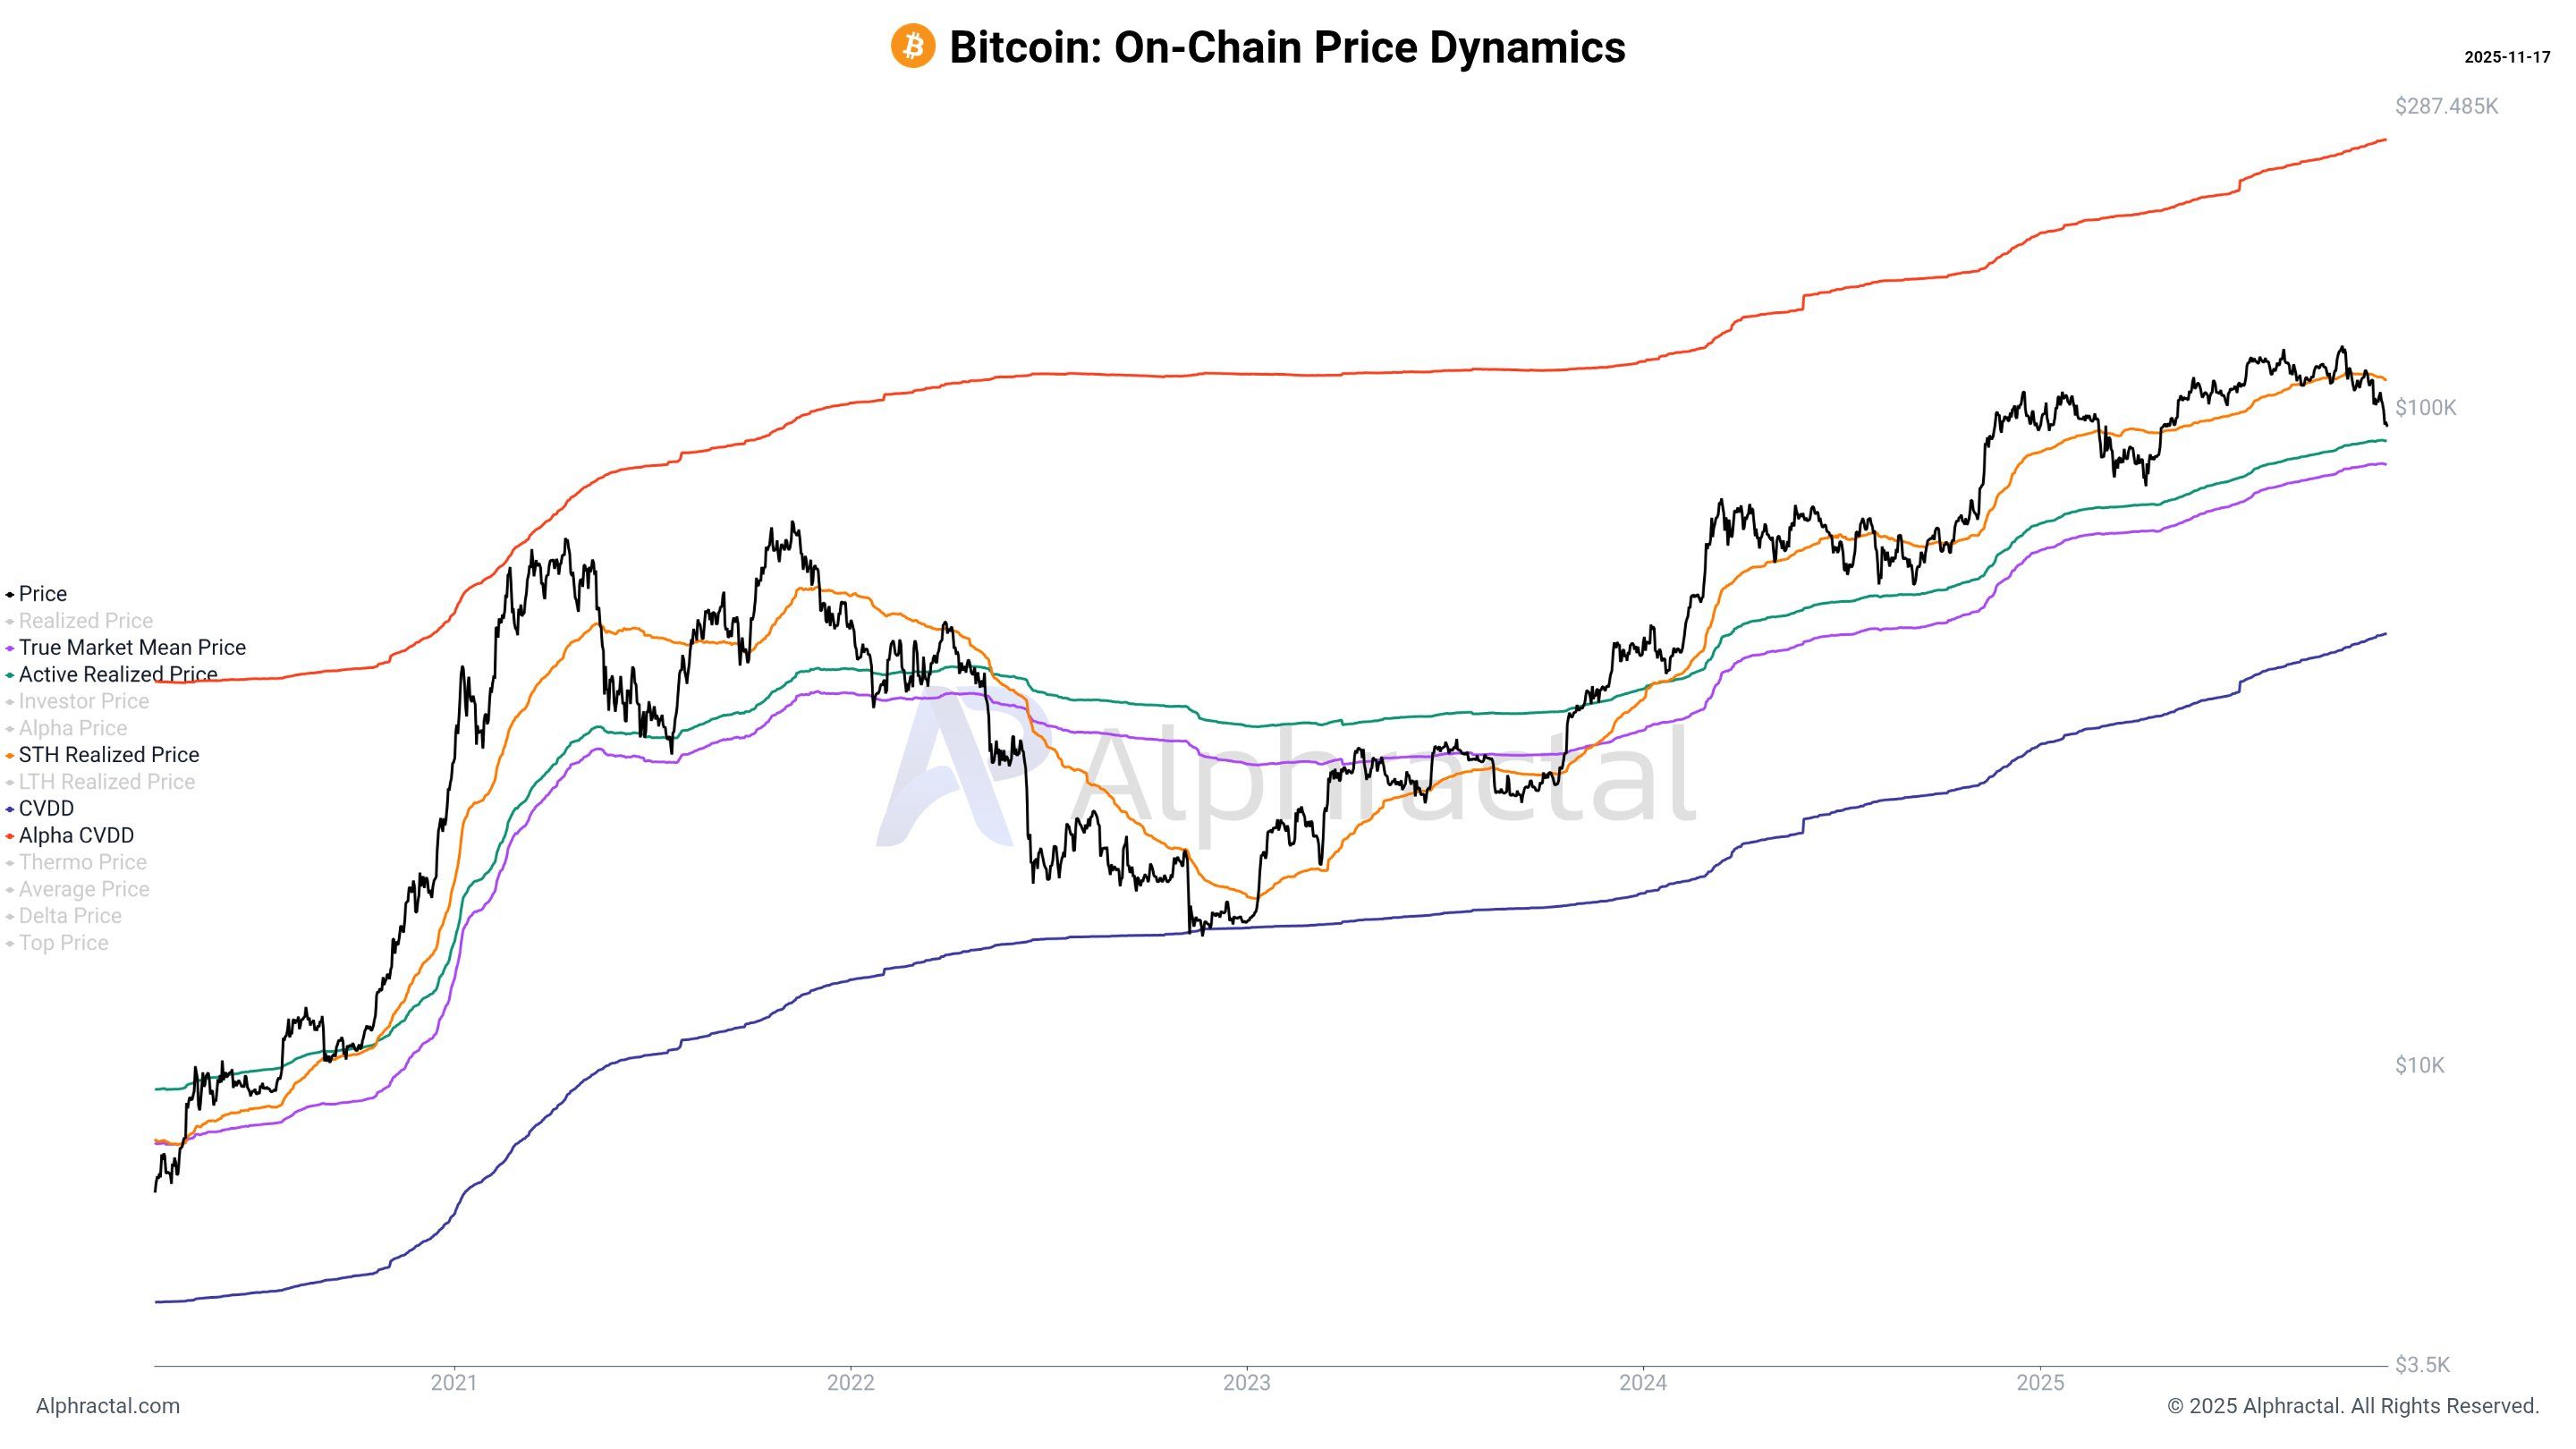 Bitcoin On-chain Price Dynamics. Source: Alphractal.
CVDD tracks the cumulative sum of value–time destruction as coins move from old holders to new holders relative to the market’s age. Historically, this metric has accurately predicted major Bitcoin bottoms.
A drop of this magnitude would bring significant consequences, especially in a market where institutions and governments have been accumulating BTC.
However, current analyses still expect Bitcoin to find a bottom around $80,000. A bullish reversal may occur if the new wave of government liquidity continues to accelerate.
The post Analysts Reveal Key Support Levels for Bitcoin if Selling Pressure Doesn’t Ease in November appeared first on BeInCrypto.


 24h Most Popular


 Utilities