Key Findings: BTC ($110,392.00) Technical Analysis
- Bitcoin daily chart printed multiple inside bars since August 8, indicating a price consolidation.
- A potential bearish breakout is expected as the price remains below the 50-EMA.
- BTC might retest the $56,881 – $52,980 zone if the price fails to exceed the $60K level.
Bitcoin Technical Analysis – BTC Daily Chart
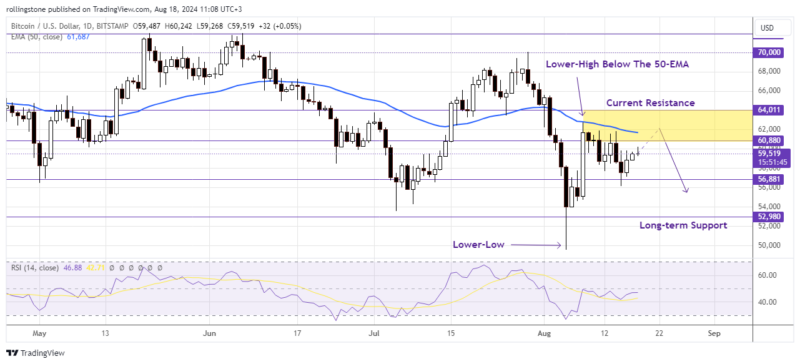 BTC/USD price rejected the resistance at $60K and might return below $56,881 following the overall downtrend. Source: The Distributed
After testing and failing to break through the resistance near $62,000 last week, Bitcoin (BTC) traded above $58,000 on Friday.
This week saw a return of the risk-on sentiment in the markets as Marathon Digital increased its holdings of 4,141 Bitcoin worth $249 million and the SEC approved a new MicroStrategy leveraged ETF, which could increase investor exposure to the cryptocurrency.
The RSI at 47.17 (below 50) indicates an overall downtrend. Besides the price remaining below the 50-EMA since August 2 suggests further bearish movements this week.
If BTC continues to find resistance around $60,880, it might fall 14% from its current trading level of $58,231 and retest the daily support near $52,980.
See Related: Bitcoin And Ethereum Technical Analysis: BTC Drops To $60K And Hints For A Further Correction
Key Findings: ETH ($3,856.02) Technical Analysis
- Ethereum develops a short-term bullish momentum but the price must break above the $3K level to initiate an uptrend.
- Technically, ETH will remain bearish as long as the price rejects the immediate resistance at $2,815.
- A clear rejection of the current trendline resistance might drive the price below the $2,300 level.
Ethereum Technical Analysis – ETH Daily Chart
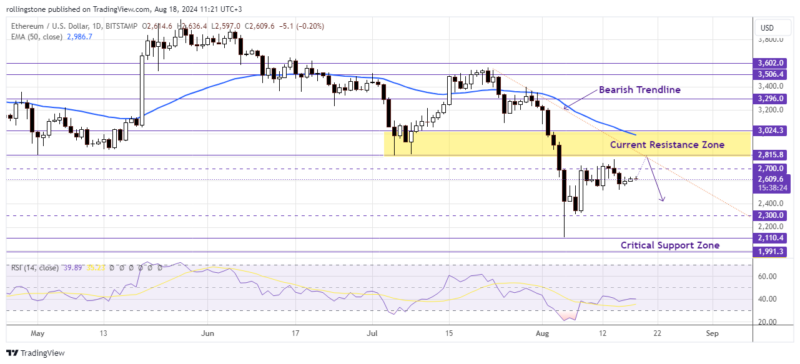 ETH/USD might initiate another downtrend move targeting $2,300 if the price fails to break the immediate resistance at $2,815.
The cryptocurrency market continues to consolidate, with Ethereum showing substantial resistance to an upward trend. Since the dramatic collapse on August 5, ETH’s price actions have been primarily horizontal, with a downward trendline serving as a continuous barrier to any recovery attempts.
The price has fluctuated over the last month, reaching $3,000 before falling around $2,600 support due to negative pressure. Ethereum price research reveals significant movement between $2.3K and $2.7K, the region in which Ethereum has been oscillating, indicating a consolidation phase.
Ethereum has found support at $2,300, a psychological level for traders. Breaking below this level might result in additional selling, potentially reaching below $2,110.
On the upside, ETH faces resistance from a declining trendline of about $2,700. Above, there may be a short-term rally, but the overall market bias is negative.
The post Bitcoin And Ethereum Technical Analysis: BTC Price Consolidation Below $60K Hints Further Corrections, And The ETH Price Might Drop Below $2.3K As The Price Failed To Exceed The $3K Zone appeared first on The Distributed.


 24h Most Popular


 Utilities