Key Findings: BTC ($110,314.00) Technical Analysis
- Bitcoin price was in an uptrend last week, although it remains in its broad stabilization zone of $57,000 to $64,000.
- A solid bullish candle breaking the 50-EMA on August 23 indicates a further bullish move above $64K.
- The resistance zone within $70,000 – $71,941 remains our potential upside target for this week.
Bitcoin Technical Analysis – BTC Daily Chart
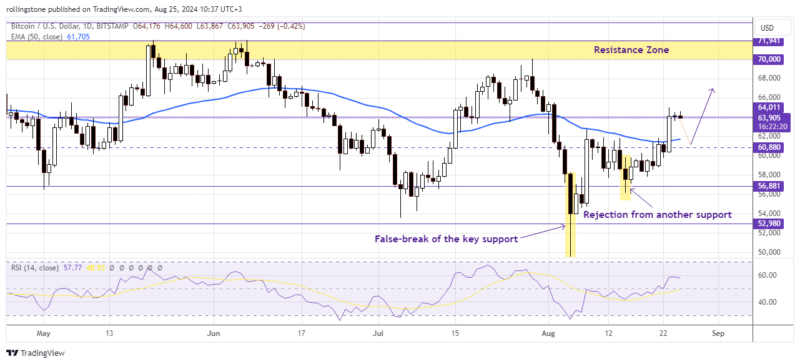 BTC/USD bulls encounter a massive challenge near the resistance at $64,011. Source: The Distributed
Bitcoin (BTC) is trading above $64,000, up over 4% so far this week despite spending the previous 15 days of range-bound movement between $57,000 and $62,000. Contradictory signals can be seen in on-chain data, where some whales sell off while institutions continue to accumulate Bitcoin.
The Relative Strength Index (RSI) at 58.17 signals an uptrend. However, the price must close above the immediate resistance at $64,032 to revive the bullish momentum and push the price back to $70K.
For a bearish outlook, failing to break the current resistance might result in a bearish sentiment and invite sellers to push the price between $60,880 and $56,881 this week. If the price fails to sustain above the $56K level, we’ll set $52,980 as the next potential downside target.
Key Findings: ETH ($3,850.56) Technical Analysis
- Ethereum failed to establish a solid bullish momentum last week as the price encountered a significant resistance at $2,815.
- A doji candle has been spotted below the current resistance, suggesting an indecision over the upcoming trend.
- ETH might retest the key support at $2,300 if the price fails to exceed the resistance zone of $2,815 – $3,024.
Ethereum Technical Analysis – ETH Daily Chart
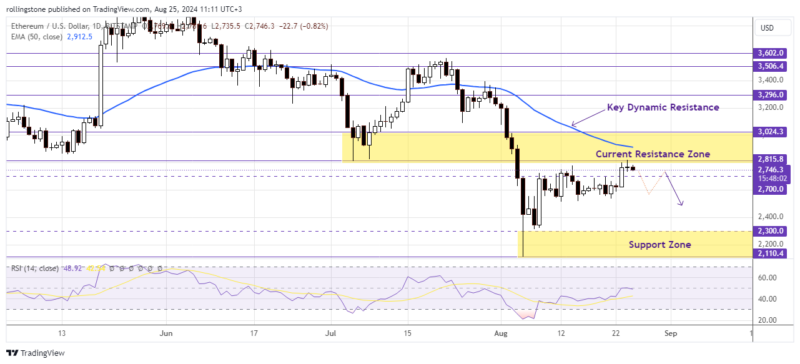 ETH/USD struggles to strengthen its bullish momentum after the price plotted a doji candle below the $2,815 support. Source: The Distributed
Ethereum price is consolidating between its August 12 low of $2,510 and its 50% fib retracement level near $2,843 according to the swing high at $3,562 and the swing low at $2,124). It is currently trading at $2,754, around 9.72% higher on August 25.
The daily ETH/USD chart printed a Doji candle right below the immediate resistance at $2,815, indicating the market is suffering from indecisions over the upcoming price direction. A break of the Doji bar’s low will confirm that the price remains below the 50-EMA resistance near $2,912. Consequently, the price might encounter an increasing sell pressure below the current resistance and drop to $2,300 following a solid bearish move.
Conversely, a bullish breakout of $2,815 and the 50-EMA levels can develop a sustainable bullish momentum driving the price above $3,024 to $3,296 this week.
The post Bitcoin And Ethereum Technical Analysis: BTC Price Hits $64K With A Bold Bullish Breakout Of The 50-EMA, ETH Daily Chart Prints A Doji Candle Right Below The Resistance At $2,815, Suggesting A Fresh Bearish Move This Week appeared first on The Distributed.


 24h Most Popular


 Utilities