Key Findings: BTC ($110,450.00) Technical Analysis
- Bitcoin initiated a strong downtrend after the price formed a head-and-shoulder pattern on the daily chart.
- The price broke a key support near $56.8K followed by a huge sell pressure below the 50-EMA.
- BTC might hit $48K this week if the price fails to sustain above the current support at $52.6K.
Bitcoin Technical Analysis – BTC Daily Chart
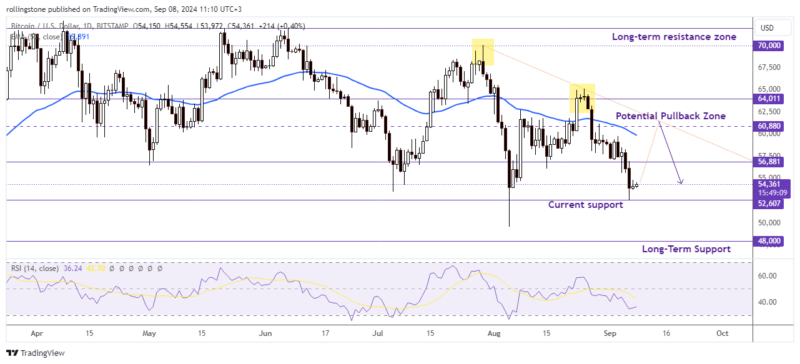 BTC/USD might continue with the overall bearish trend targeting the long-term support at $48K. Source: The Distributed.
Bitcoin price broke the critical support at $56K after the price plotted a bearish breakout of the recent consolidation range ($59,850 – $57,248). While initiating the downtrend move, the price also rejected the 50% Fibonacci retracement level at $59,650.
Since BTC/USD broke the key support at $56,881 with the RSI below 50 (37.38), we might see the price break the current support at $52,607 and continue the bearish rally to the $48,000 level.
However, the daily chart shows a tiny inverted hammer plotted inside the large bearish candle formed on September 6. It indicates Bitcoin might go for a pullback move before making another bearish move.
In case of a potential pullback, BTC could retrace near the $60K level and follow the daily bearish trendline to make another downside rally aiming for a further downside target near $48,000. On the other hand, sustaining above the current support at $56,881 may trigger a short-term bullish momentum but the price is still far away from shifting to a solid uptrend at this moment.
See Related: Bitcoin And Ethereum Technical Analysis: BTC Tests Resistance Above $60K, ETH ($3,858.04) Could Pullback To $3.2K Before Rejoining Downtrend
Key Findings: ETH Technical Analysis
- Ethereum’s bearish move stalled above the support at $2,110 after the daily chart printed an inverted hammer candle.
- The price is expected to pull back to the $2.7K – $2.8K zone before plotting another bearish move.
- If ETH prints a lower high on the daily chart this week, we might see the price creating a lower low near $1,750.
Ethereum Technical Analysis – ETH Daily Chart
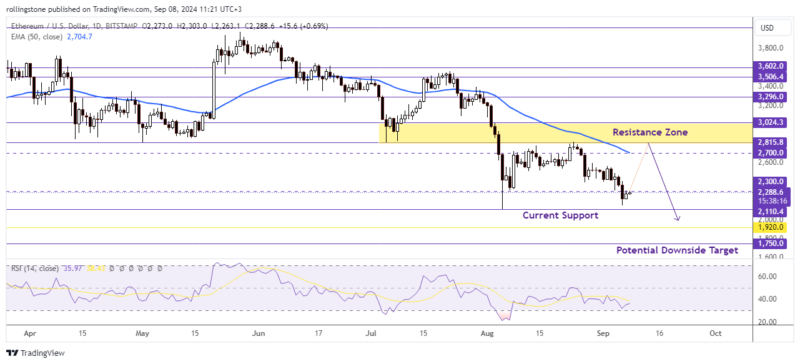 ETH/USD traders will look for short opportunities on pullbacks until the price exceeds $2,815. Source: The Distributed.
Ethereum’s downtrend move stalled after the price avoided a retest of the $2,110 level and plotted a small bullish hammer above the support. Despite the strong bearish sentiment in the market, ETH has plenty of room to pull back inside the $2.7K – $2.8K zone before rejoining the recent bearish trend.
Additionally, the RSI at 36.91 indicates the price has already reached near the oversold zone and makes a short-term retracement against the overall downtrend. If the price rebounds for a bearish move below the 50-EMA, Ethereum might continue for a further downside move targeting $1,750.
For a bullish outlook, ETH/USD must break and hold above the $2,815 level to initiate a sustainable uptrend.
The post Bitcoin And Ethereum Technical Analysis: BTC Price Tests Major Support At $52K Following A Solid Downtrend, And The ETH Could Pullback Near $2.7K Before Rejoining The Bearish Rally appeared first on The Distributed.


 24h Most Popular


 Utilities