Key Findings: BTC ($109,650.00) Technical Analysis
- Bitcoin broke a major resistance near $64K following a stunning bullish move initiated after the Fed’s rate cut decision.
- The daily chart shows a bullish breakout of multiple inside bars, suggesting a further upside rally.
- BTC could retest $70K if the price holds above the $64K level this week.
Bitcoin Technical Analysis – BTC Daily Chart
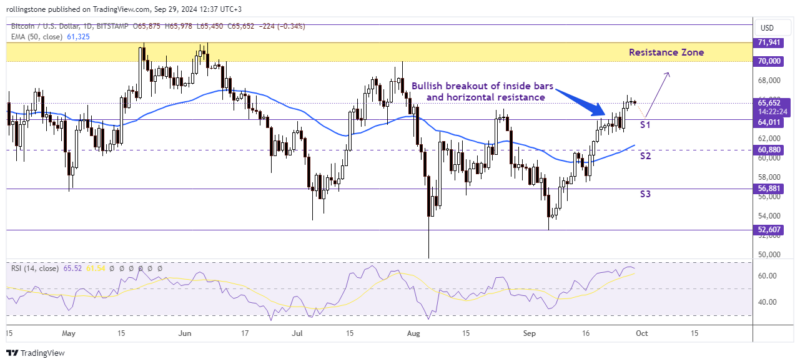 BTC/USD’s bullish rally targets the $70K level following multiple breakouts at key price levels. Source: The Distributed
Bitcoin price recently broke a critical level and appears to be on track for a new ATH ($0.03) this week. The daily chart shows that the price has already broken above $64K and plotted a bullish breakout of multiple inside bars above this level.
With the RSI indicating a clear bullish momentum, the cryptocurrency is expected to continue its climb toward the minor resistance near $68K in the short term.
Otherwise, in the event of a pullback, the 50-day exponential moving average is likely to hold the price and drive the market higher.
Since rebounding from the $52K level, the price has been developing higher highs and lows on the daily chart. The market’s bullish rise has resulted in a distinct upside momentum that has supported Bitcoin for weeks. If this trend continues, the market will soon exceed $68,000, unlocking the next target at the $70K level.
On the other hand, if the current support at $64K is broken to the downside, a pullback to the $60K level is expected.
See Related: Bitcoin And Ethereum Technical Analysis: BTC Must Maintain The Support Level At $70K
Key Findings: ETH ($3,838.55) Technical Analysis
- Ethereum kept consolidating within a tight range of $2.5K- $2.7K last week.
- Despite a short-term bearish momentum, the price still holds above the 50-EMA.
- ETH might pull back up to $2.3K before initiating another bullish move targeting the $2.8K – $3K zone.
Ethereum Technical Analysis – ETH Daily Chart
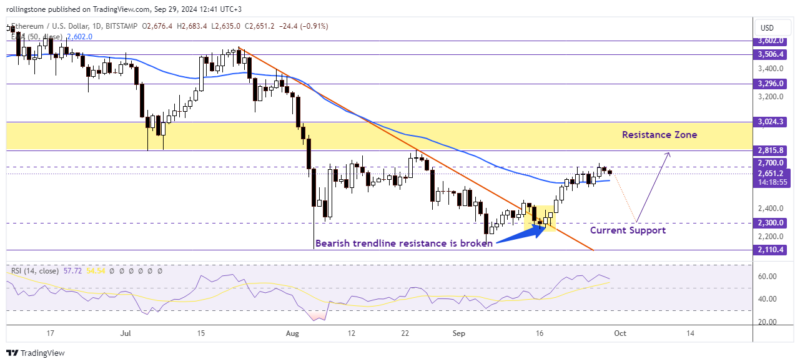 ETH/USD might hit the $2.8K – $3K zone this week but the price must sustain above the 50-EMA. Source: The Distributed
Ether’s price motion is similar to Bitcoin’s, but less striking overall. The second-largest cryptoasset has regained its 50-day EMA following last week’s price action but holds below the late August high in the $2,800 range as we go to press, leaving the technical picture neutral for the time being.
Bulls would like to see ETH/USD reclaim important previous support that turned resistance at $2,815 to plot an upbeat outlook for Ether, whilst a break below $2,300 support might pave the way for a move toward the next level of support near $2,100.
The post Bitcoin And Ethereum Technical Analysis: BTC Targets $70K After Breaking Key Resistance, ETH Rally Stalls Below $2.7K But Consolidates Above The 50-EMA appeared first on The Distributed.


 24h Most Popular


 Utilities