

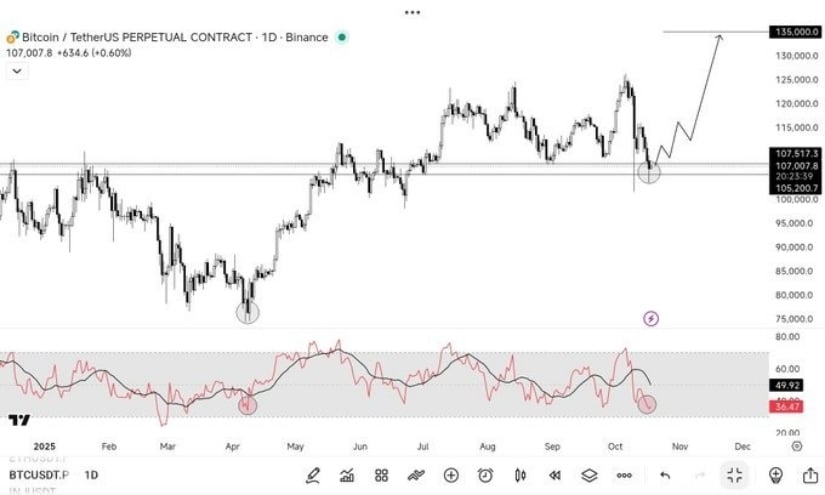
After a sharp 20% drop from $125K, Bitcoin’s RSI now sits at 36—historically a level that precedes strong bullish reversals. Analysts predict BTC ($102,224.00) could stage a powerful comeback if its ascending channel support holds firm.
Bitcoin RSI Flashes Oversold Signal as Price Slides Below Key Levels
Bitcoin (BTC) has entered a critical phase after its daily Relative Strength Index (RSI) dropped to 36, signaling oversold conditions for the first time in months. The move comes after a sharp 20% correction from early October highs near $125,000 to lows around $100,000—sparking speculation that the market could be forming a local bottom.
Bitcoin’s RSI hits oversold—traders call it the bottom as $BTC eyes a bold rebound toward $135K. Source: @FriedrichBtc via X
Prominent trader @FriedrichBtc described the setup as a potential turning point, writing, “RSI oversold, bottom is in. $135K next!” His projection aligns with Bitcoin’s historical recovery patterns from similar RSI levels, where past dips have often preceded 15–25% rebounds within weeks.
Bitcoin Finds Historical Support at the 50-Week Moving Average
A separate analysis by @wacy_time1 pointed to Bitcoin’s recurring bounces off its 50-week simple moving average (SMA)—often a launchpad for major rallies since 2023. The analyst wrote, “Every massive BTC rally since March 2023 started from this blue line. Is this time different?”
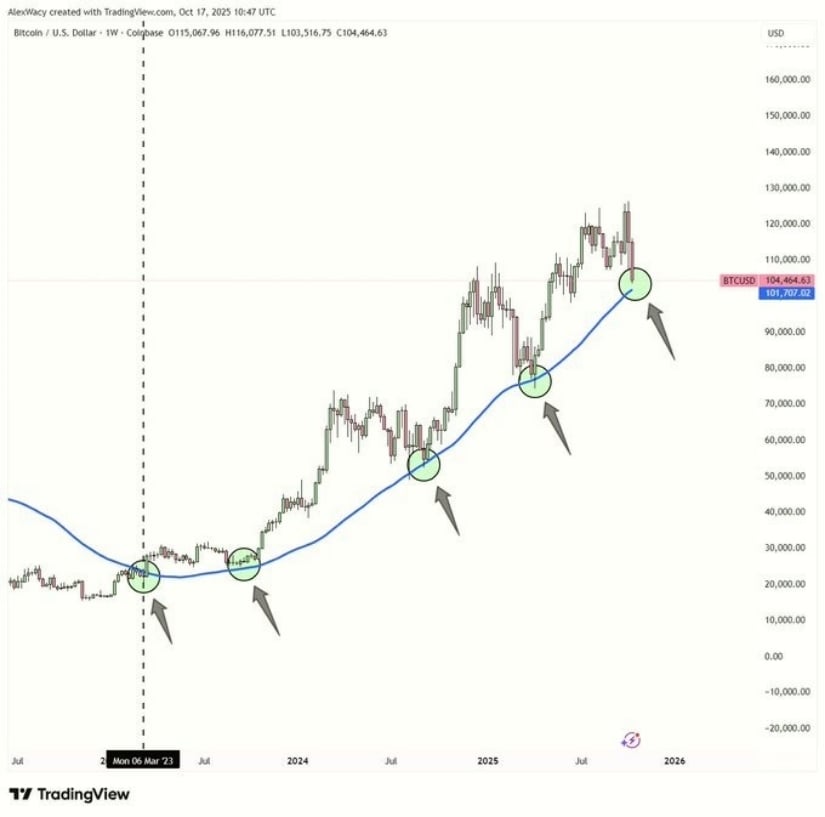
Every major Bitcoin rally since March 2023 began at the blue line—will history repeat for $BTC this time? Source: @wacy_time1 via X
The chart highlights prior reversals from ~$20K (Mar 2023), ~$25K (Jun 2023), ~$55K (Jul 2024), and ~$90K (Jul 2025). The current test around $101K–$103K marks the fifth touch of this long-term support level. Historically, each retest has sparked gains exceeding 30%, though repeated tests may weaken its reliability.
Market sentiment remains mixed. Bullish traders view this level as a proven rebound zone, while others caution that a decisive break below could trigger a deeper correction—potentially toward the 200-week moving average near $88K.
Analysts Split as Bears Warn of a “Fakeout” and Bulls Eye $135K
Popular YouTube channel Altcoin Daily reignited the debate with a viral post captioned “It’s so over #Bitcoin”—a phrase that ironically marked previous market bottoms. The post featured a multi-year ascending trendline connecting Bitcoin’s major lows since 2023, suggesting that the latest correction near $108K may mirror prior “fakeout” breakdowns that led to sharp recoveries.
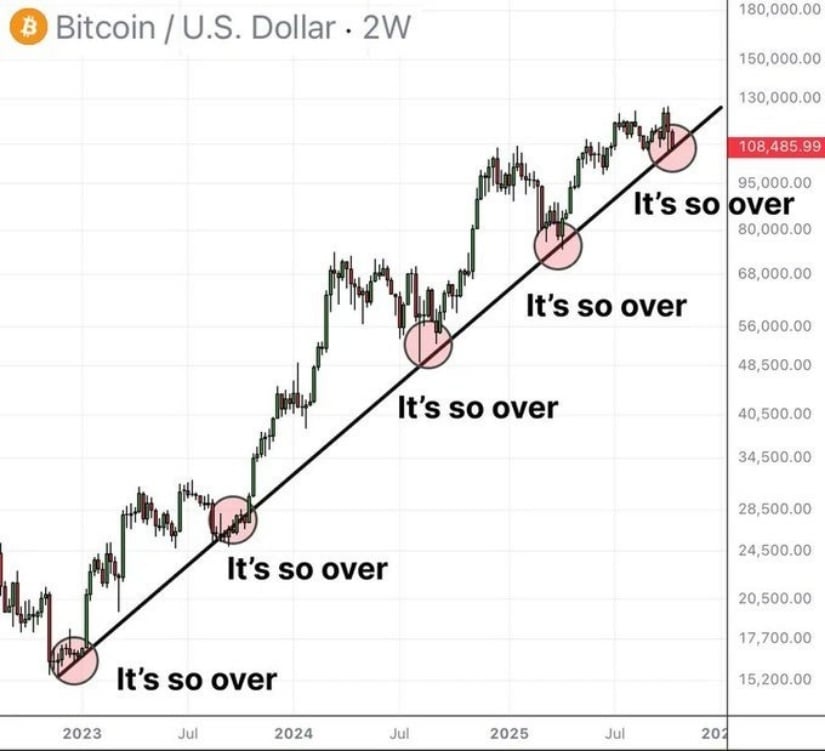
It’s so over—but Bitcoin may be gearing up for its next major rebound. Source: @AltcoinDaily via X
Bulls argue that history could repeat, citing Bitcoin’s resilience at the same trendline over the past two years. “ATH ($0.03)’s next. We are bullish,” replied trader @AltcoinGordon, while skeptics warned that repeated dips below the line could signal structural weakness.
Technical Outlook: Oversold Conditions Could Precede Relief Rally
From a technical standpoint, Bitcoin’s daily RSI below 40 reflects short-term exhaustion among sellers. Analysts tracking RSI behavior note that similar readings in 2023 and 2024 preceded strong upward reversals. If BTC maintains support above $100K, traders are watching for a potential recovery toward the $120K–$135K resistance zone.
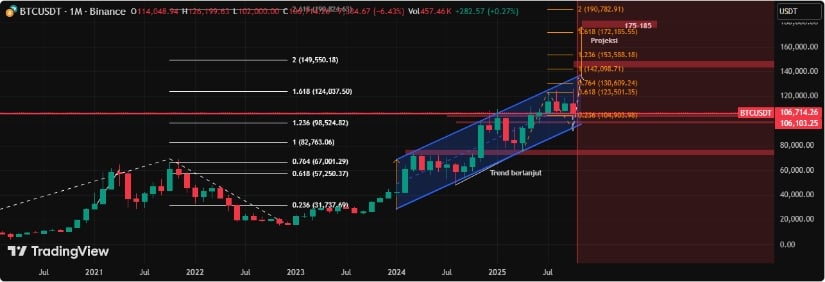
Bitcoin may dip near $100K before blasting off toward $135K, showing this volatility is just a temporary pause. Source: Tbone8899 on TradingView
However, if the RSI fails to recover above 50, the bounce could remain corrective rather than the start of a new bullish phase. Bitcoin’s next move may hinge on macro factors, ETF flows, and liquidity trends across crypto derivatives markets.
Market Context: Bitcoin ETF Inflows and Institutional Sentiment
Institutional interest remains a wildcard. Despite recent volatility, spot Bitcoin ETFs from BlackRock, Fidelity, and Grayscale continue to attract modest inflows, suggesting long-term accumulation by large holders.
According to Brave New Coin data, Bitcoin’s market cap remains above $2 trillion, maintaining dominance over the broader crypto sector, even as the global crypto market cap briefly slipped under $3.8 trillion earlier this week.
Looking Ahead: Is the $135K Recovery Back on the Table?
Bitcoin’s technical structure suggests a pivotal moment ahead. The combination of an oversold RSI, proximity to the 50-week SMA, and historical rebound behavior supports the bullish case for a potential recovery toward $135K.
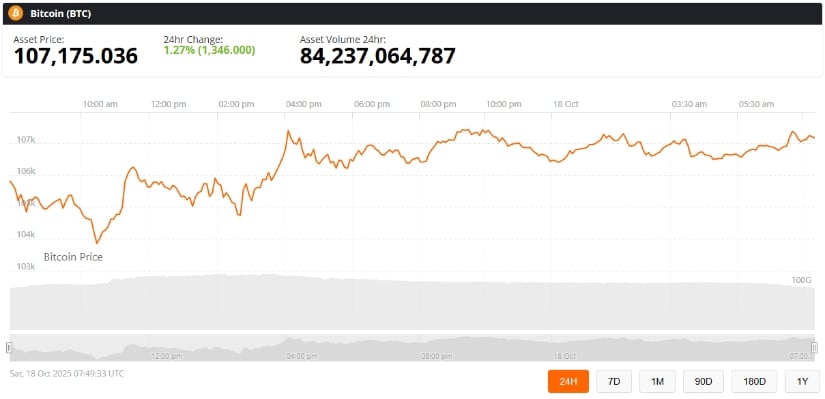
Bitcoin (BTC) was trading at around $107,175, up 1.27% in the last 24 hours at press time. Source: Bitcoin Price via Brave New Coin
Still, caution remains warranted. A confirmed daily close below $100K could invalidate the reversal setup and open the door to further downside pressure.
For now, Bitcoin sits at a crossroads between capitulation and recovery—and traders appear split on whether this dip marks the start of a new leg higher or just another stop on the path of consolidation.


 24h Most Popular


 Utilities