

Hidden bullish divergences on RSI, MACD, and Stochastics suggest potential short-term strength, but on-chain data and market structure point to caution. Traders and investors are monitoring these critical levels to gauge Bitcoin’s next move in an increasingly volatile market.
Bitcoin Holds Key Levels Amid Market Uncertainty
Bitcoin (BTC) is trading near $95,000 as of November 17, 2025, following a 25% pullback from its October all-time high of around $130,000. Historically, Bitcoin has experienced similar 20–30% retracements in post-halving cycles before resuming trend acceleration, as seen in 2017 and 2020. The current consolidation resembles those previous ranges, signaling a period of careful observation rather than panic.
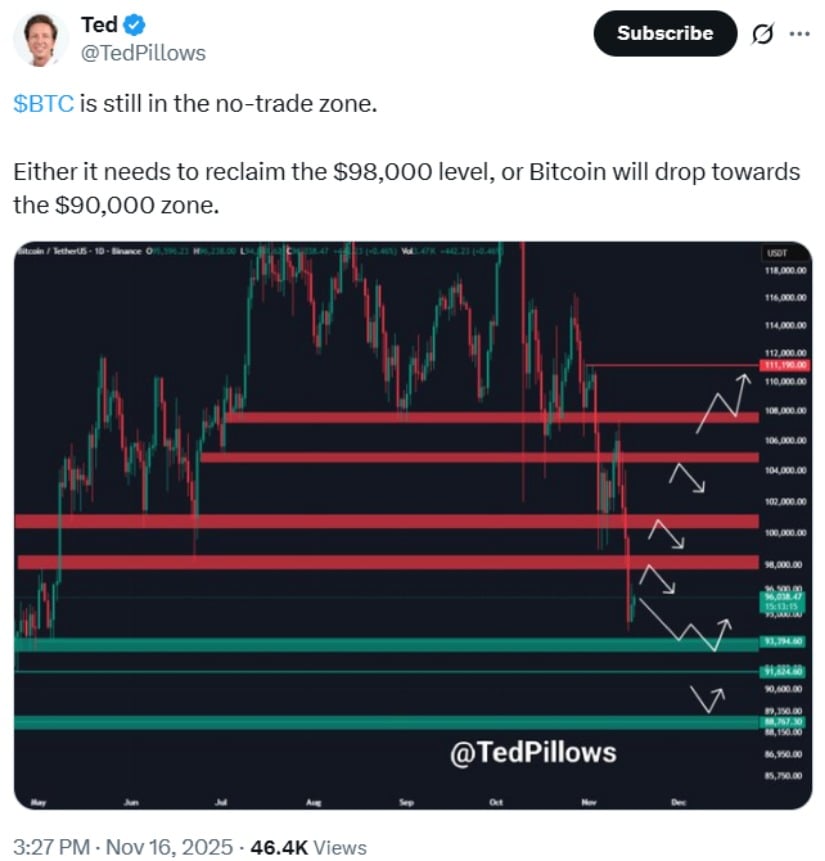
Bitcoin remains in a no-trade zone, eyeing $98K resistance or risking a drop to $90K support. Source: @TedPillows via X
Crypto market analyst Ted (@TedPillows), who focuses on market structure and trend analysis, described the current level as a “no-trade zone,” noting that “Either it needs to reclaim the $98,000 level, or Bitcoin will drop towards the $90,000 zone.” This reflects the need for traders to wait for clear signals before taking positions.
Technical Indicators Signal Caution
Several technical factors suggest Bitcoin may encounter heightened volatility. The daily chart shows an approaching “death cross,” a pattern in which the 50-day moving average crosses below the 200-day moving average. While this historically signals momentum loss and potential 20–30% corrections, bull-market cycles can sometimes produce false signals, requiring additional context.
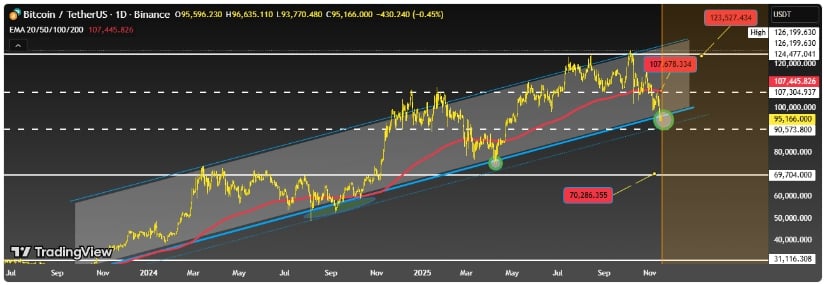
Bitcoin’s moves toward $107K remain corrective, with cautious momentum as USDT ($1.01) dominance rises and $90.5K support holds critical risk levels. Source: MrWyckof on TradingView
On-chain data from Glassnode indicates over 50,000 BTC moved to exchanges in the past week, a sign of increased whale activity that could add pressure to the market. However, JPMorgan’s proprietary mining economics model points to a $94,000 production cost floor, which may act as support and limit downside.
TradingView analyst MrWyckof, specializing in technical charting, noted that “the moves up to the $107K region are still just corrections. Previous rising channel tests showed hidden bullish divergences on RSI, MACD, and Stochastics, which led to strong recoveries.” Hidden bullish divergences occur when momentum indicators suggest potential strength despite price pullbacks—a signal traders often use to anticipate rebounds.
Short-Term Scenarios: Relief Rally and Further Weakness
Crypto trader Alejandro₿TC (@Alejandro_XBT), known for his on-chain and intraday analysis, suggested Bitcoin could first dip to $87,000 before a short-term relief rally toward $100,000, potentially benefiting altcoins along the way. These scenarios are possibilities, not predictions, and depend on broader market sentiment and liquidity conditions.
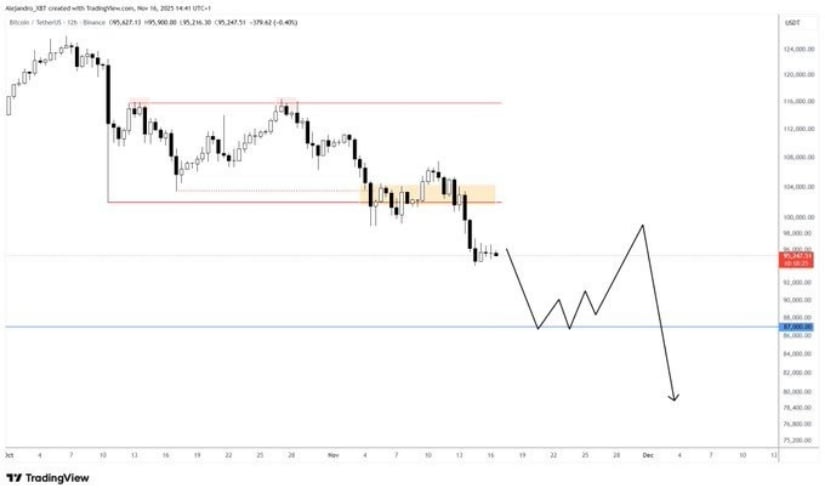
Bitcoin eyes a dip to ~$87K, with a potential relief rally to ~$100K, while altcoins could surge during the rebound. Source: @Alejandro_XBT via X
The USDT dominance (USDT.D) index, which measures stablecoin market share, has risen above its long-term descending trendline, reflecting growing demand for safer assets. This suggests a risk-off environment, as traders seek stability during Bitcoin’s current retracement.
Key Support and Resistance Levels
-
Support: $90,500 is a critical level. A daily close below this could open the door for deeper corrections toward $69,000–$70,000, based on historical horizontal support levels.
-
Resistance: $98,000 must be reclaimed to signal bullish continuation. Failure to break this level could prolong consolidation or trigger further retracement.
-
Corrective targets: Moves toward $107,000 remain corrections, supported by hidden bullish divergences in key momentum indicators.
Market Outlook: Balanced but Cautious
Overall, Bitcoin demonstrates both resilience and caution. Hidden bullish divergences signal potential for recovery, while ongoing whale selling, an impending death cross, and rising stablecoin demand highlight risks.
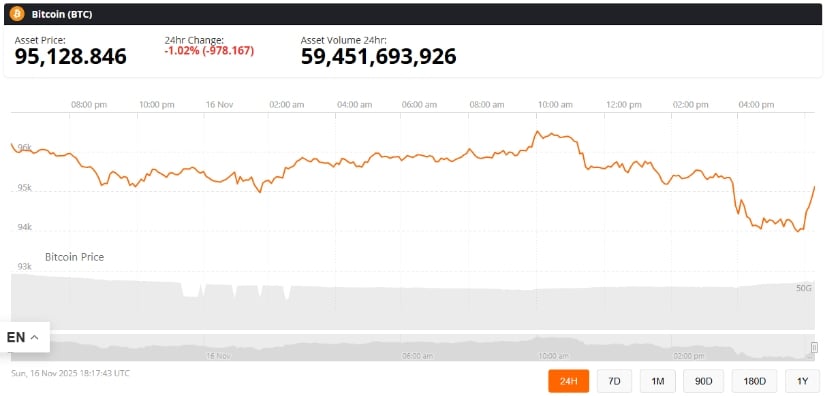
Bitcoin was trading at around 95,128, down 1.02% in the last 24 hours at press time. Source: Bitcoin price via Brave New Coin
For investors considering how to invest in Bitcoin, this range emphasizes monitoring technical indicators, on-chain metrics, and macroeconomic factors rather than chasing price predictions. Traders should remain attentive to $90,500 support, $98,000 resistance, and potential corrective zones near $107,000, using these levels as guides rather than guarantees.


 24h Most Popular


 Utilities