
Bitcoin (BTC ($111,140.00)) price is trading near $111,000, up almost 2% in the past 24 hours and about 63% higher year-on-year. The broader trend remains bullish, but one familiar signal has reappeared – the same one that sparked a 15% rally last month.
Now, the only thing standing in the way is one critical resistance level.
The Same Bullish RSI Signal Is Back
The Relative Strength Index (RSI), which tracks buying versus selling momentum, is flashing a hidden bullish divergence, a setup that often signals trend continuation.
Between June 22 and October 17, Bitcoin’s price formed higher lows, while the RSI printed lower lows, a pattern showing fading selling pressure even as the price stays steady.
This exact setup appeared between June 22 and September 25, just before BTC jumped 15.7% toward its recent high. If the same percentage move is respected, this BTC price bounce could settle around $119,900 this time.
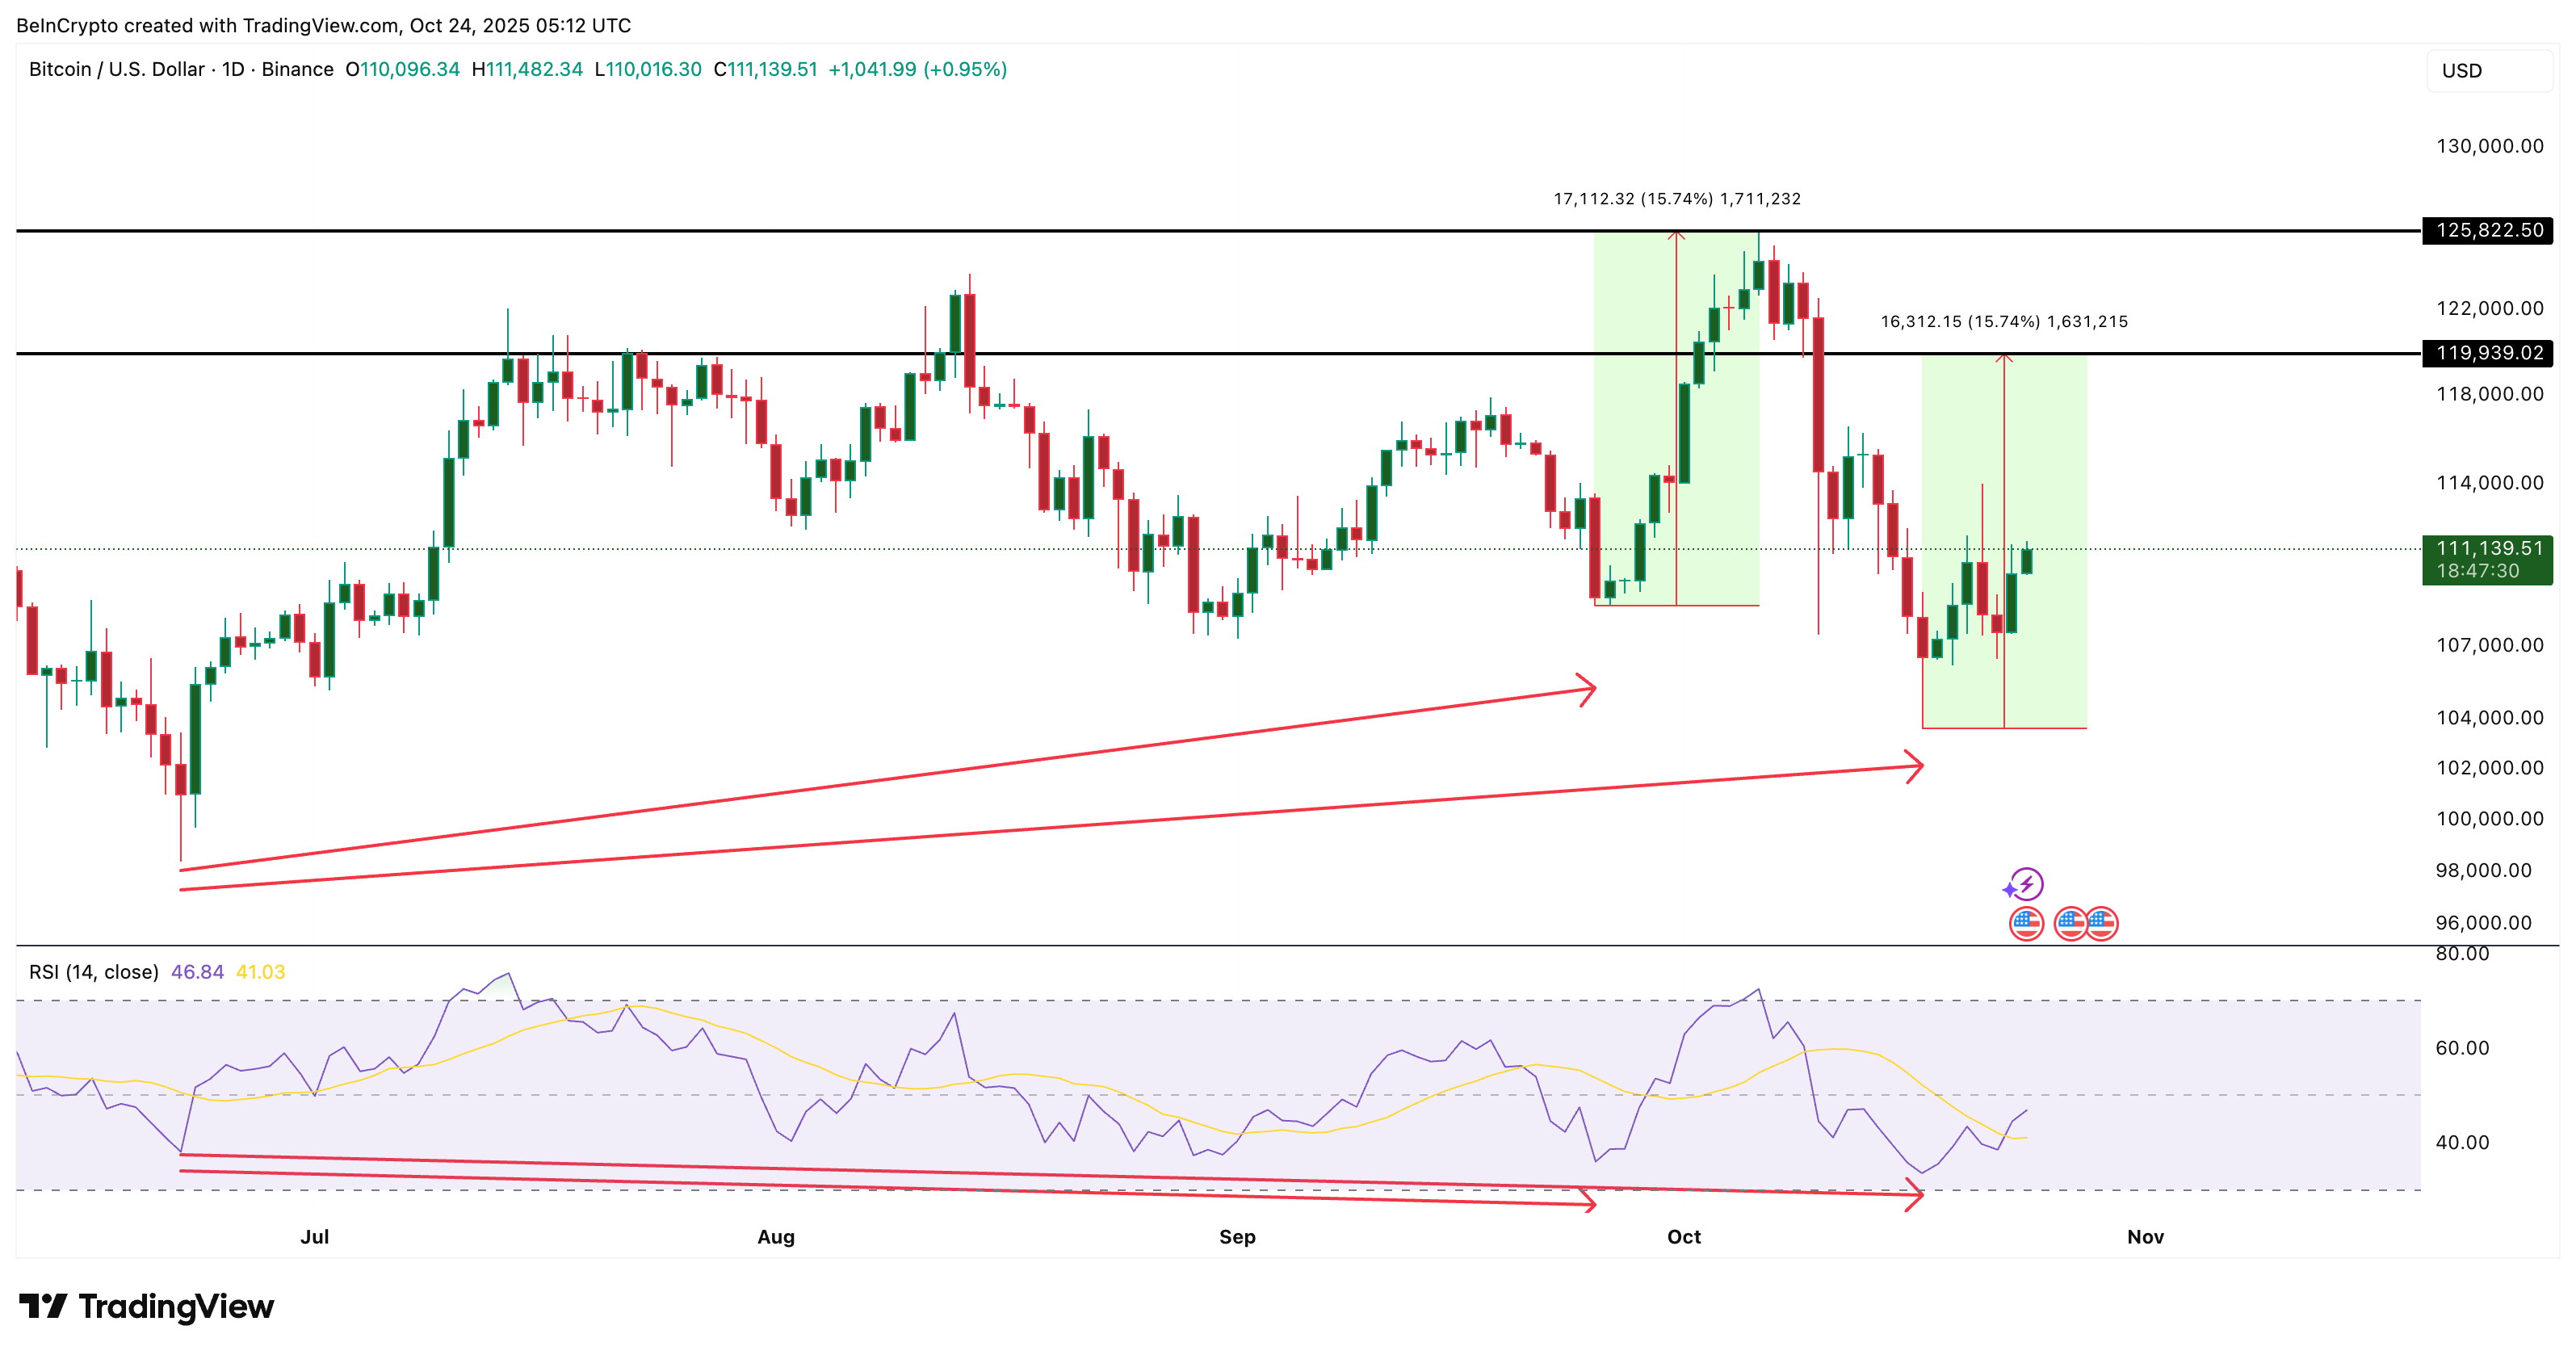 Bitcoin Price Fractal Showing Bullish Divergence: TradingView
The repeated signal now suggests that buyers are quietly regaining strength and that another upside move may be forming.
Want more token insights like this? Sign up for Editor Harsh Notariya’s Daily Crypto Newsletter here.
On-Chain Metrics Back the Bullish Case
Two on-chain indicators strengthen this outlook. The first is Net Unrealized Profit/Loss (NUPL), which measures how much profit holders have on paper. When NUPL is low, there’s less reason for investors to sell.
As of October 23, NUPL sits close to its three-month low of 0.48. The last time it touched this level, Bitcoin’s price gained 3.8% within days.
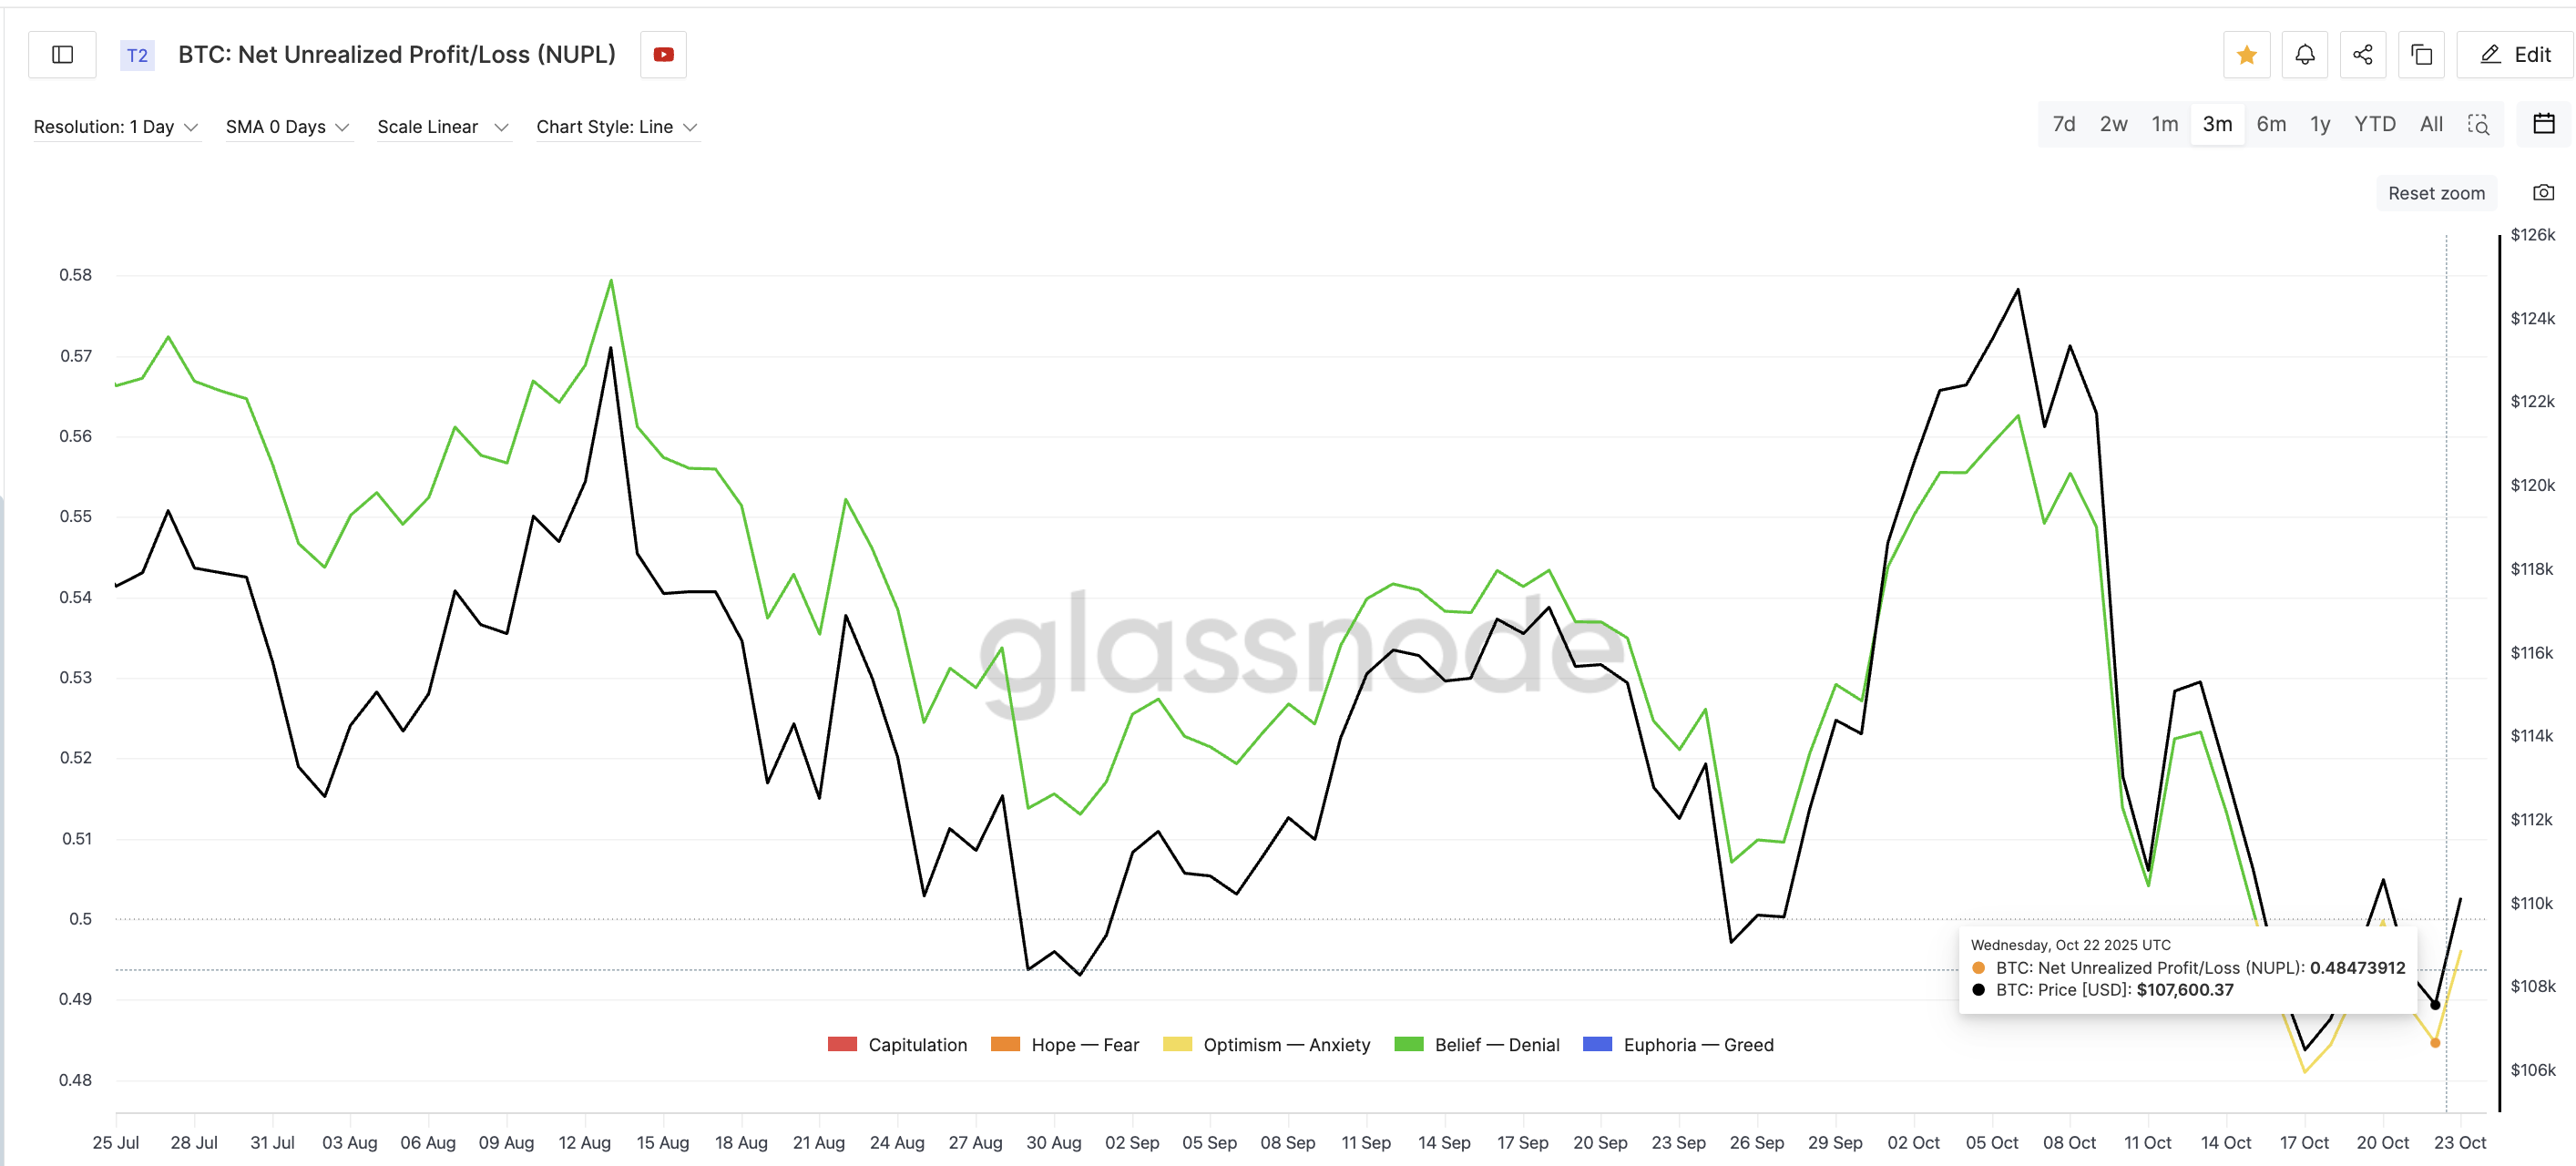 Lower Incentive To Sell Bitcoin: Glassnode
The second is the Accumulation Trend Score. This metric tracks how actively different groups of investors are buying or selling Bitcoin based on wallet size. It considers both the size of each entity’s holdings (participation score) and how much they’ve added or sold in the past month (balance change score).
A value closer to 1 means larger entities — such as whales or funds — are aggressively accumulating, while a value near 0 signals distribution or inactivity. The metric provides a clear picture of how the biggest market participants are positioning on-chain.
As of October 23, Bitcoin’s Accumulation Trend Score has climbed back to 1, showing that large holders are once again in active buy mode. This shift confirms renewed confidence and supports the broader bullish structure forming on the charts.
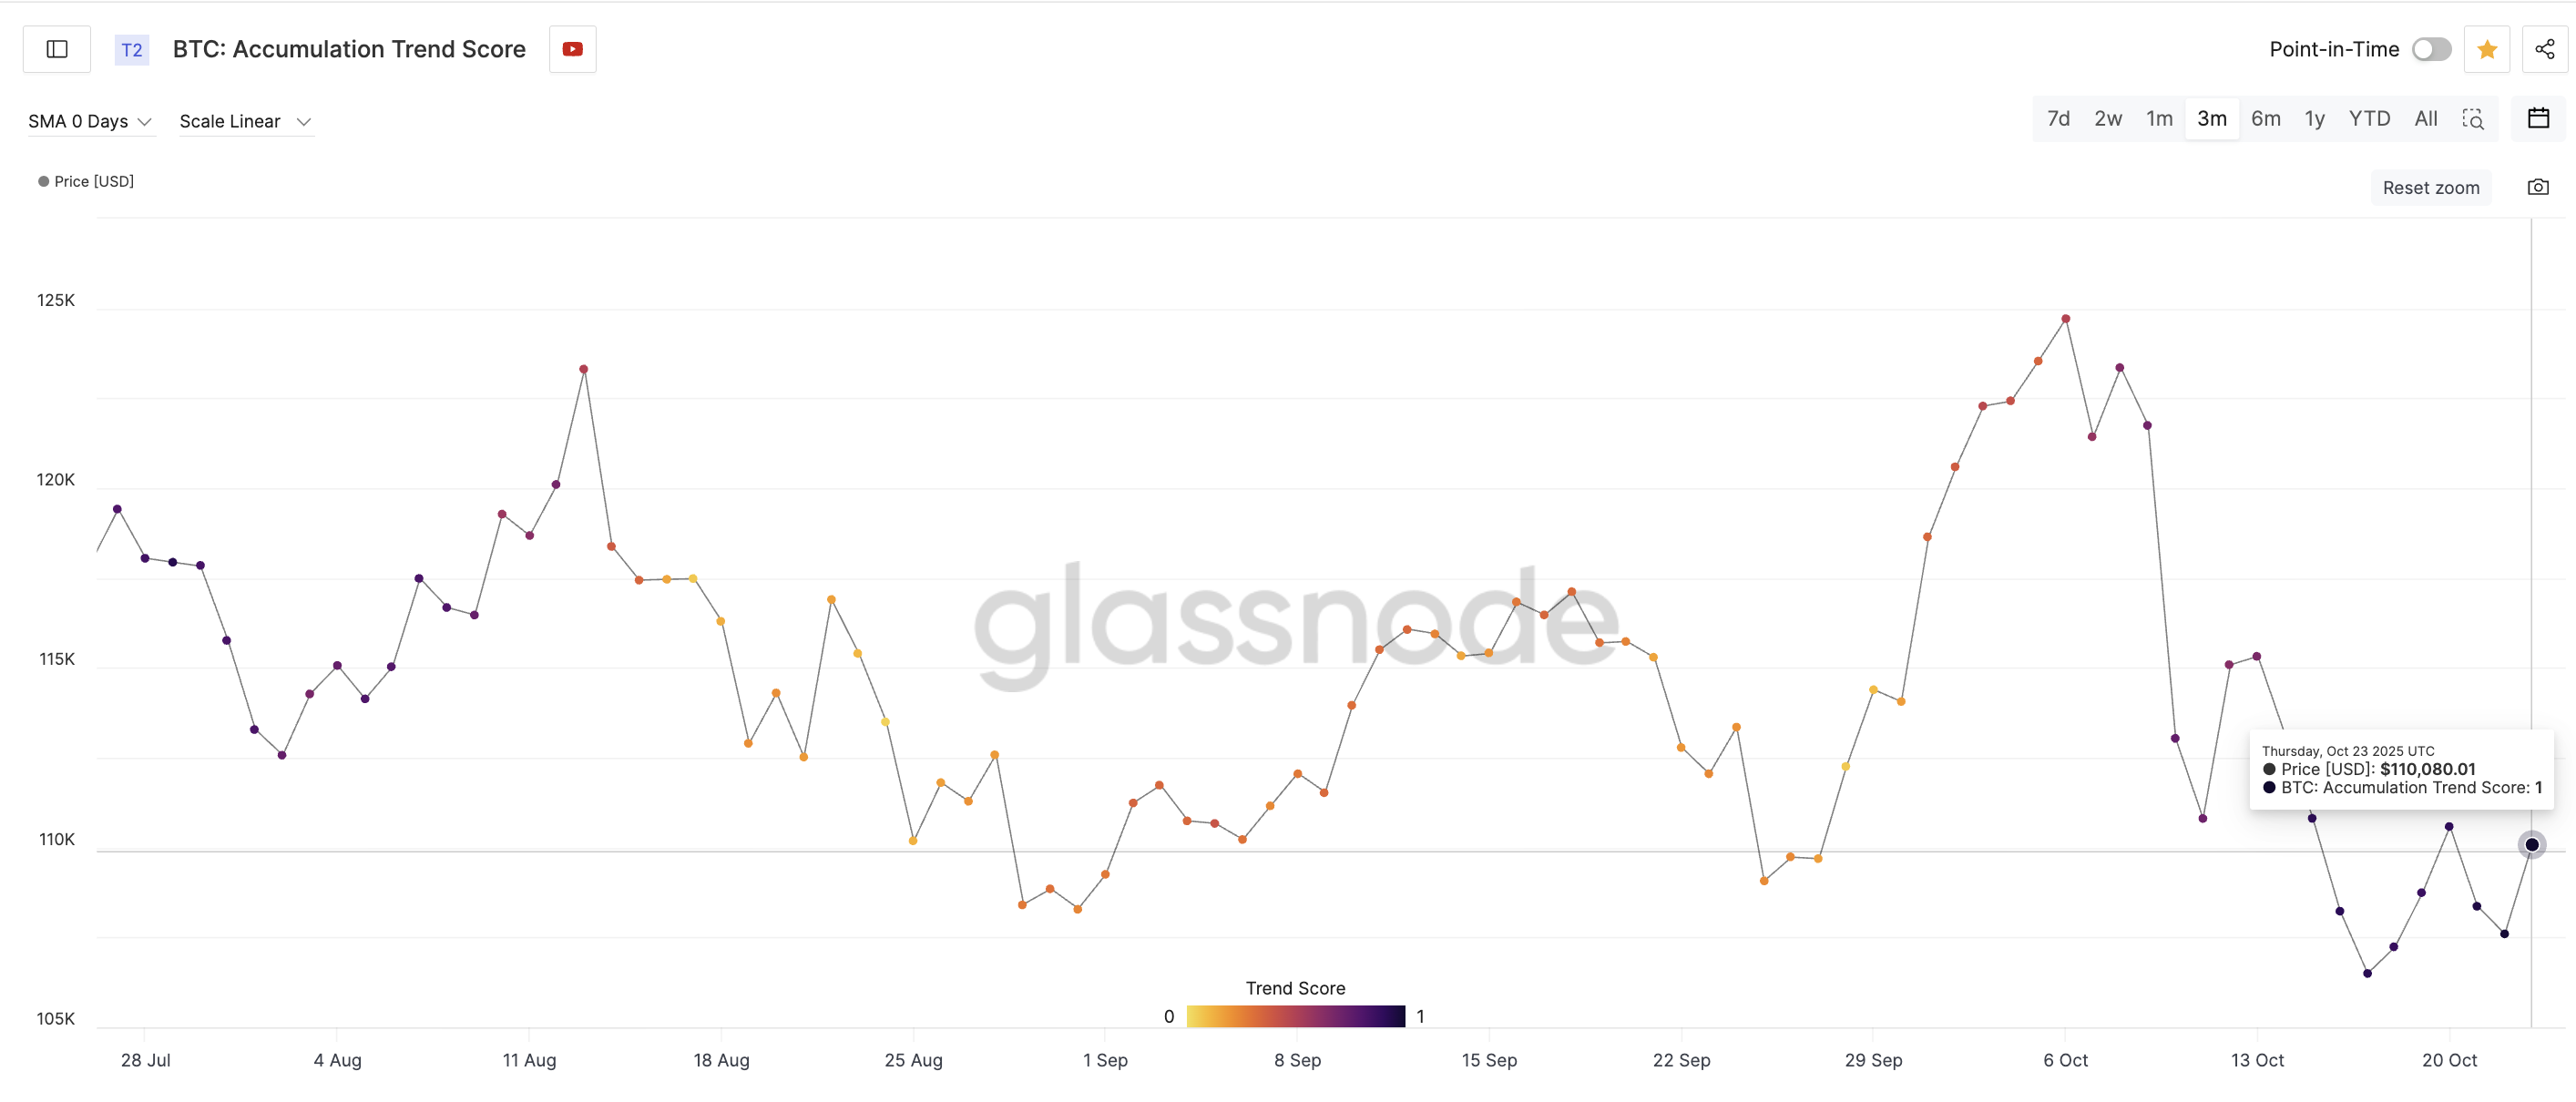 BTC Accumulation Trend Score Hits 1: Glassnode
This reinforces that the current bounce isn’t retail-driven alone; stronger hands are stepping in.
$116,500: This Bitcoin Price Level That Decides the Next Move
While the signals are promising, Bitcoin’s $116,500 level remains the make-or-break zone. Every rally attempt since October 11 has stalled there.
A daily close above it could confirm the RSI’s bullish setup and trigger a move toward $119,700, aligning with the RSI-driven rally projection of over 15%. Beyond that, even $125,700 comes into view as a Bitcoin price target.
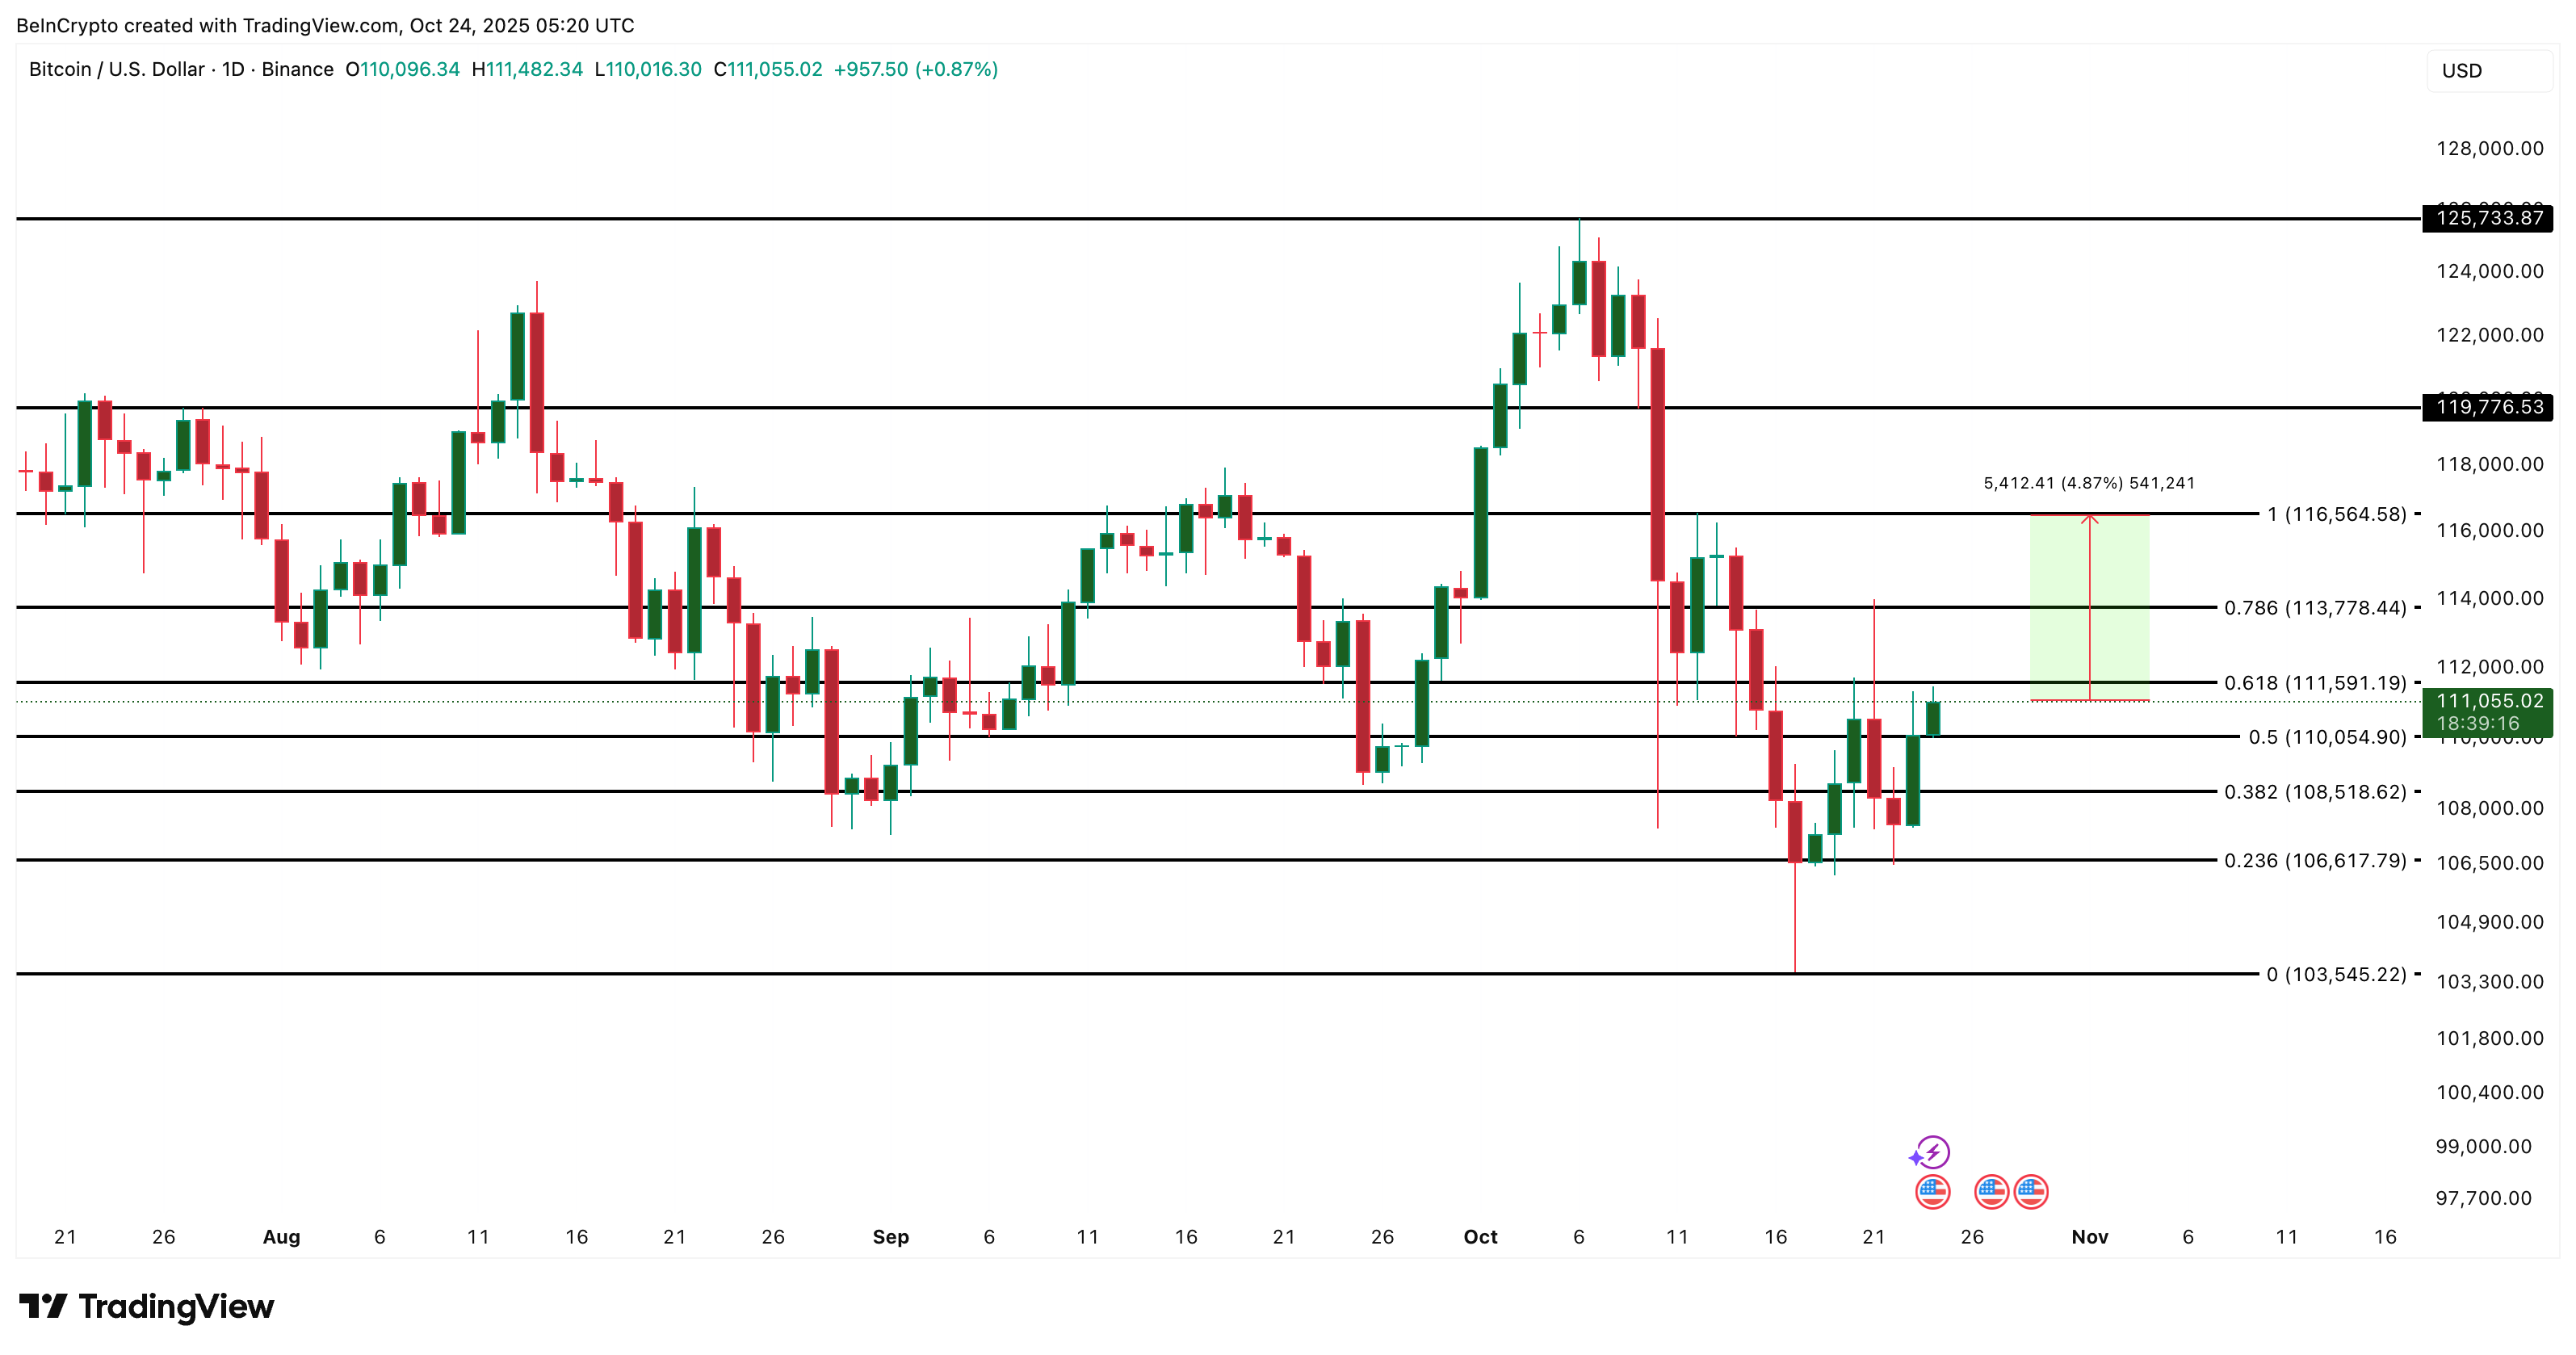 Bitcoin Price Analysis: TradingView
On the downside, support rests near $110,050, and losing that could push BTC toward $108,500 or even $106,600.
The post Bitcoin Flashes the Same Signal That Triggered a 15% Rally — One Level Holds the Key Now appeared first on BeInCrypto.


 24h Most Popular


 Utilities