.png)
Dogecoin has come under pressure, falling more than 6% in the past 24 hours and over 14% in the last week.
As of press time, it is trading near $0.174. The drop is part of a broader market pullback.
Technical Setup Shows Familiar Pattern
Trader Tardigrade, a crypto chart analyst, has pointed out a recurring formation on Dogecoin’s daily chart. The pattern is known as a descending contracting wedge. It is taking shape with three clear touches on the lower support line and two touches on the upper resistance line. This same setup appeared on the chart in August and led to a sharp move upward after the breakout.
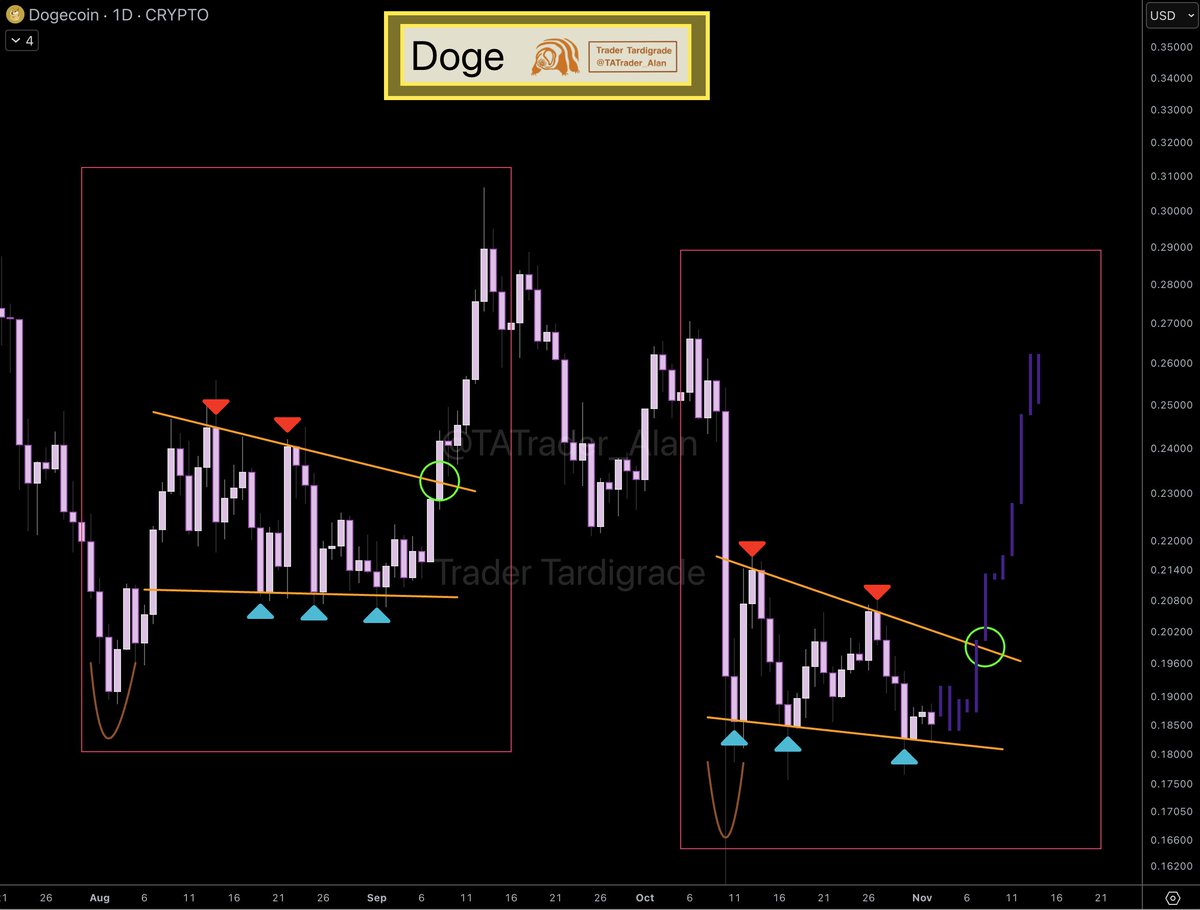 Source: Trader Tardigrade/X
The current wedge, formed between October and early November, closely matches the earlier pattern. A breakout from the resistance line has already occurred, marked by a green circle on the chart shared by Tardigrade. If the past price movement repeats, Dogecoin could see a short-term rise toward the $0.26 to $0.28 range. The structure alone, however, does not confirm direction. It will depend on volume and trader participation.
In addition to the daily chart, Tardigrade also shared a broader monthly view. Dogecoin appears to be forming a long-term rounding bottom pattern. Based on the chart’s depth, this setup could project a move toward $4.14. This structure reflects price behavior over a much more extended period and does not suggest any immediate shift.
Moreover, another key formation can be seen on the 3-day chart, where Dogecoin is trading inside a wide ascending channel. The asset is now near the bottom of that channel, which has previously acted as support.
$Doge/3-day#Dogecoin has been moving within a large Ascending Channel.
It’s currently positioned at the bottom of the channel  pic.twitter.com/lkSB3ChbLd
— Trader Tardigrade (@TATrader_Alan) November 3, 2025
Indicators Reflect Weak Momentum
The Relative Strength Index (RSI) on the daily chart is now at 35. While not yet oversold, it is approaching levels that may cause short-term price stabilization or a bounce.
Meanwhile, Bollinger Bands show the price moving below the lower band, suggesting increased downside volatility or selling exhaustion. The 20-day moving average currently stands at $0.19185, which Dogecoin is trading well below.
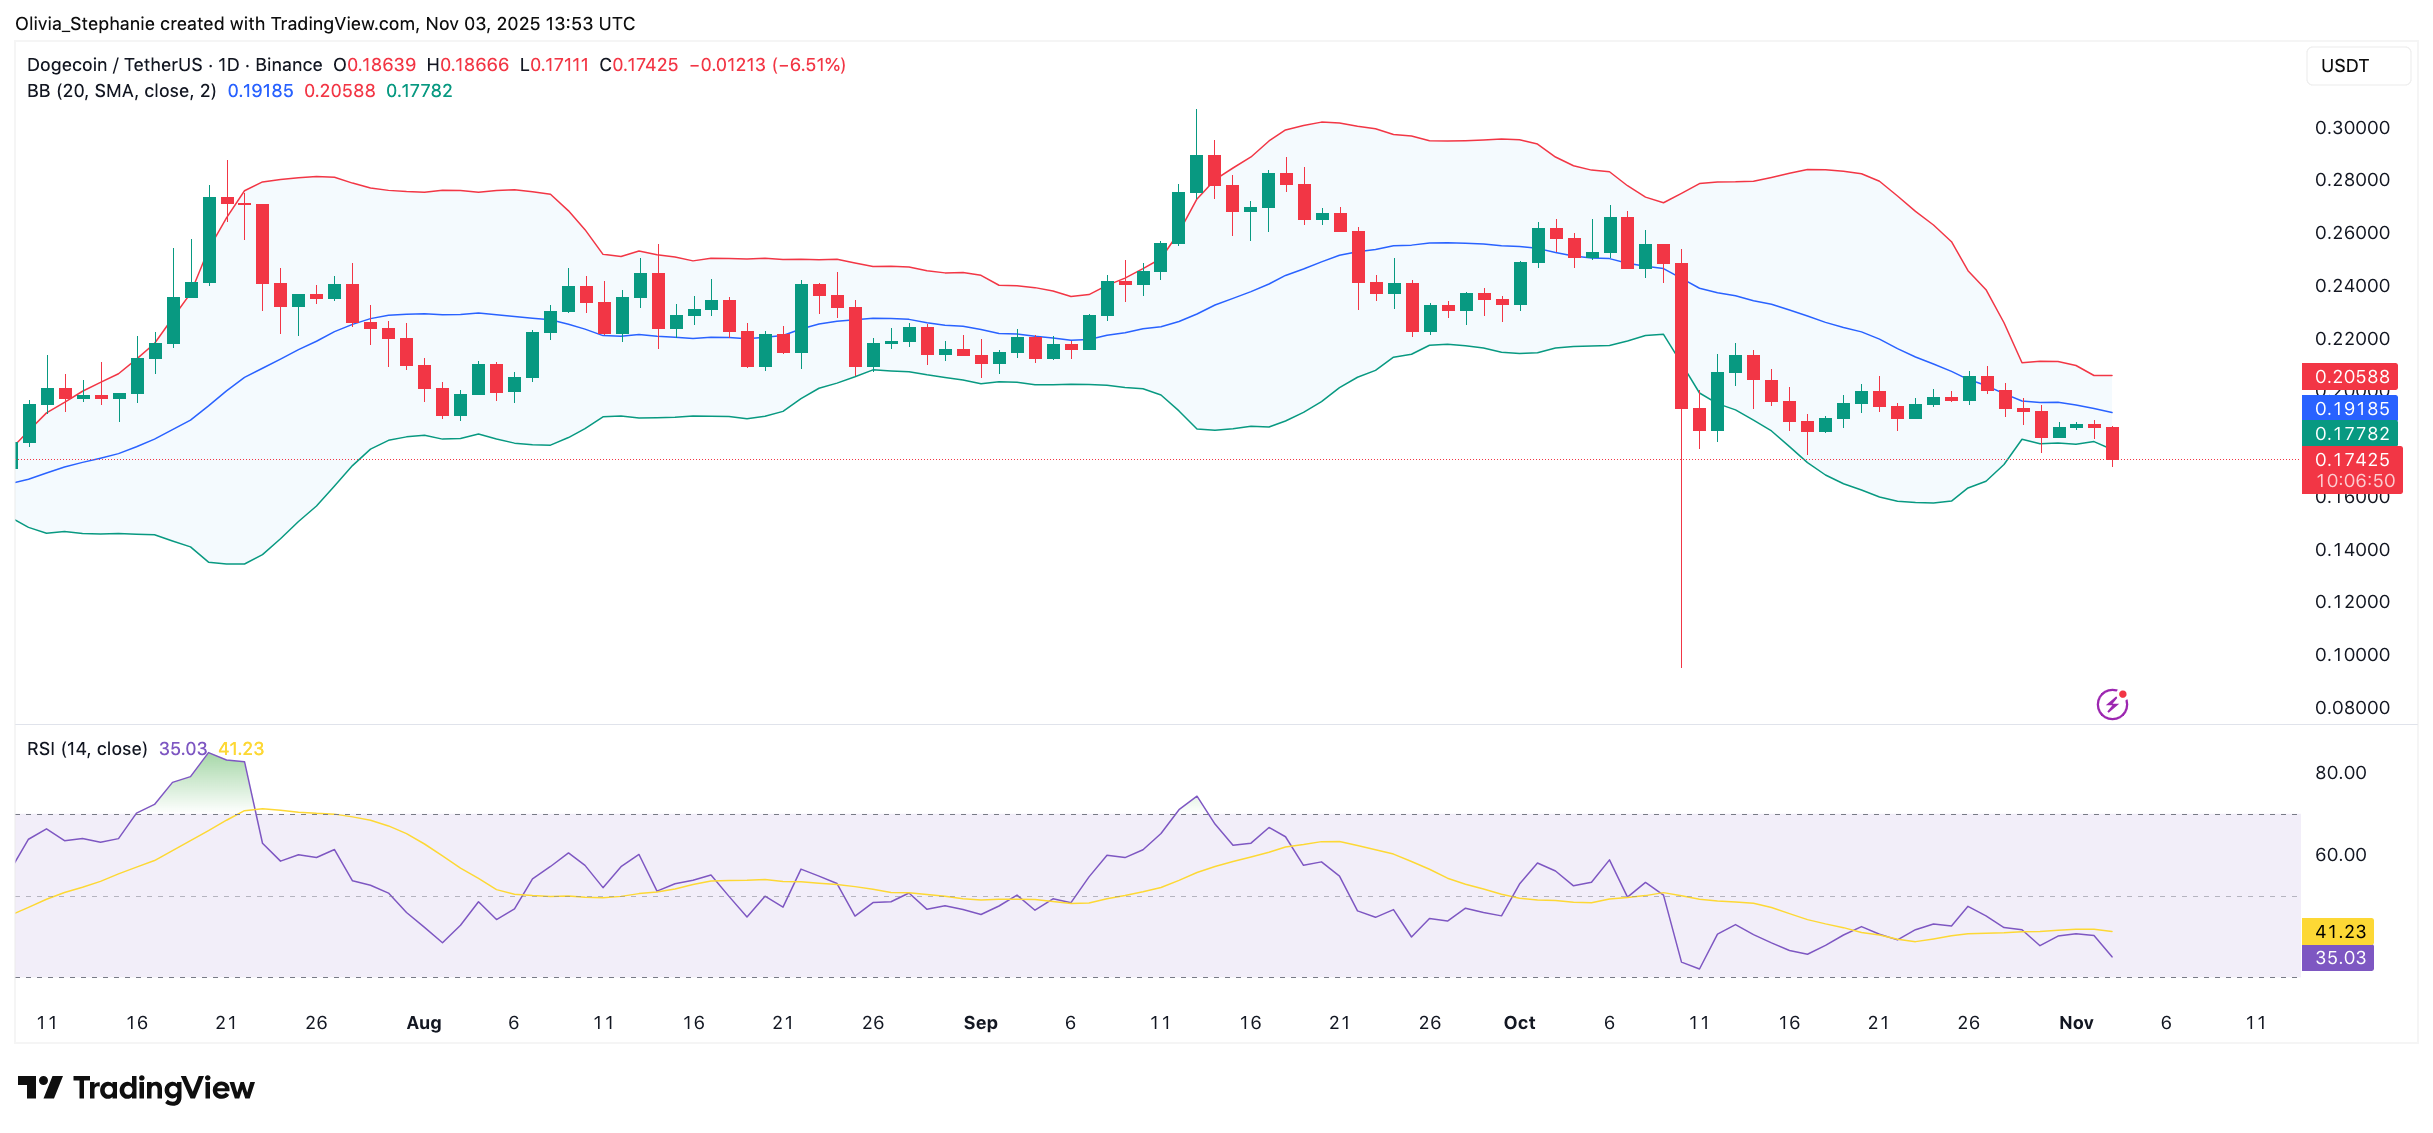 Source: TradingView
Crypto analyst Ali Martinez stated that $0.18 is a key support level. He referred to it as a “strong buy-the-dip zone” if the price holds. Since the asset is now under this level, its strength will be tested.
Whale Activity and Futures Market Show Cooling Interest
Wallets holding 10–100 million DOGE sold 440 million tokens over three days last week. This large-scale selling added to the recent price pressure and may have led smaller investors to follow.
Open interest in Dogecoin futures currently stands at $1.67 billion. This is far below its previous peak of over $6 billion. Lower open interest often reflects reduced trading activity and less leverage in the market. With both price and open interest moving lower, there is little sign of strong directional momentum for now.
The post Dogecoin Dips Under Key Support – Yet a Breakout Pattern Is Forming appeared first on CryptoPotato.


 24h Most Popular


 Utilities