

This analysis combines technical indicators, historical price structures, and expert commentary to provide a measured perspective on DOGE ($0.14)’s near- and medium-term outlook.
DOGE Trades Below Immediate Support
After falling beneath the $0.14–$0.15 range, Dogecoin has been trading near $0.138, representing a roughly 3% daily decline. According to CoinMarketCap data, DOGE’s 24-hour trading volume stands at $6.17 billion, with a market capitalization of $20.78 billion and dominance of 0.72%. The recent decline reflects broader cryptocurrency market pressures, including high-volume selling across major assets. Volume currently remains slightly below its 30-day average, suggesting moderation in trading activity compared with prior weeks.
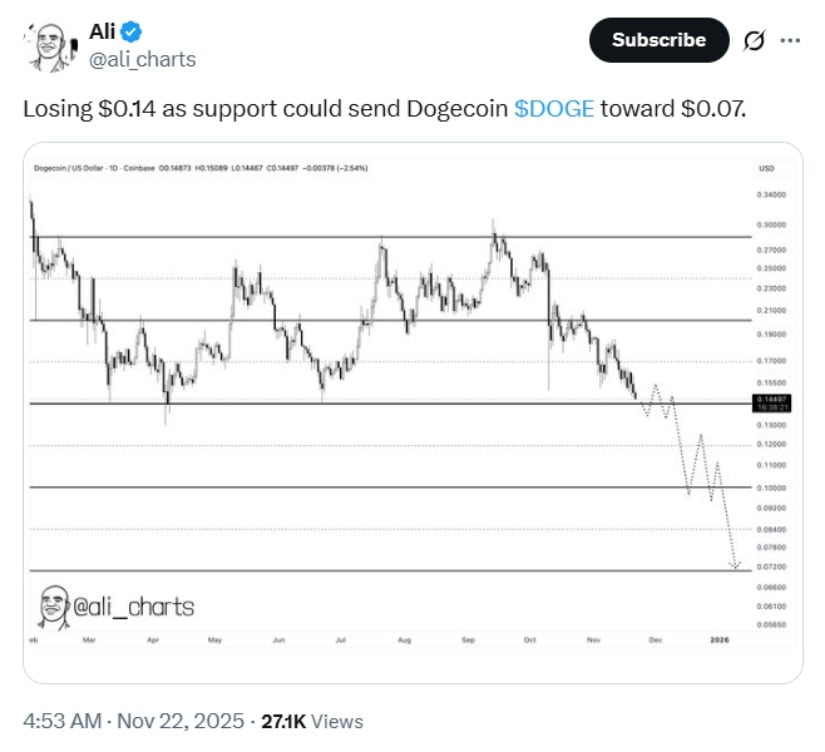
A sustained drop below $0.14 could trigger a cascading decline for Dogecoin (DOGE), opening the door toward the $0.07 level. Source: Ali Martinez via X
Ali (@ali_charts), a technical analyst specializing in cryptocurrency pattern analysis, noted that “a sustained weekly close below $0.14 could open the path toward the $0.07 macro support.” Analysts highlight that this downside projection assumes continued selling pressure and a failure to hold higher lows on the weekly chart, while oversold RSI levels below 30 could provide conditions for a potential rebound if the $0.07 support holds.
Long-Term Symmetrical Triangle Indicates Consolidation
On the weekly chart, DOGEUSDT has formed a long-term symmetrical triangle since 2021, defined by declining swing highs and progressively higher lows. Observations include:
-
Price is retesting the triangle’s rising support line, measured from 2021 swing lows.
-
Trading volume has gradually contracted over recent months, consistent with consolidation phases.
-
The structure has maintained higher lows, suggesting ongoing accumulation rather than immediate breakdown.
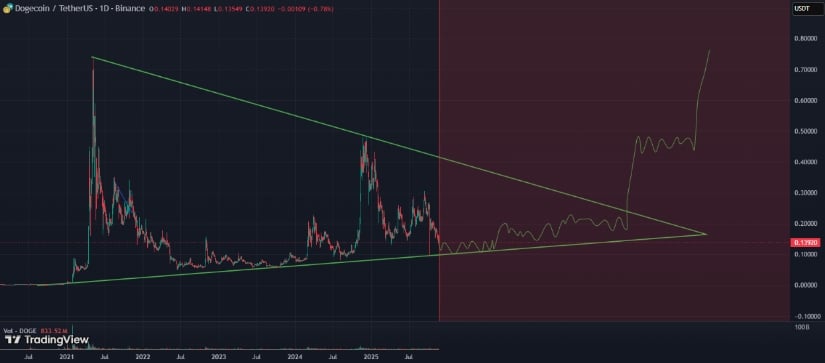
DOGE/USDT ($1.00) is trading within a long-term triangle, testing rising support, with a breakout or downside retest possible. Source: sika0409 on TradingView
Market participants note that if DOGE breaks out above the triangle apex with confirming volume, a sharp upward move could follow. Conversely, failure to hold the lower support line could validate a decline toward macro support near $0.07.
Short-Term Trading Range
On daily charts, Dogecoin is currently oscillating between $0.1300 and $0.1350, forming a potential accumulation base.
Technical patterns suggest a bearish accumulation scenario in the near term, while resistance levels around $0.1500–$0.1550 remain key for any upside momentum. In the worst-case scenario, DOGE could retest the $0.0900–$0.0950 range on a monthly scale, though a break above $0.1800 would indicate a recovery trend is forming.
Monthly Chart Indicators and Support Zones
Cantonese Cat (@cantonmeow), known for providing long-term trend analysis using Ichimoku and Fibonacci models, notes that on the monthly Ichimoku model, DOGE is approaching the lower boundary near $0.04—a level historically aligned with multi-year dynamic support.
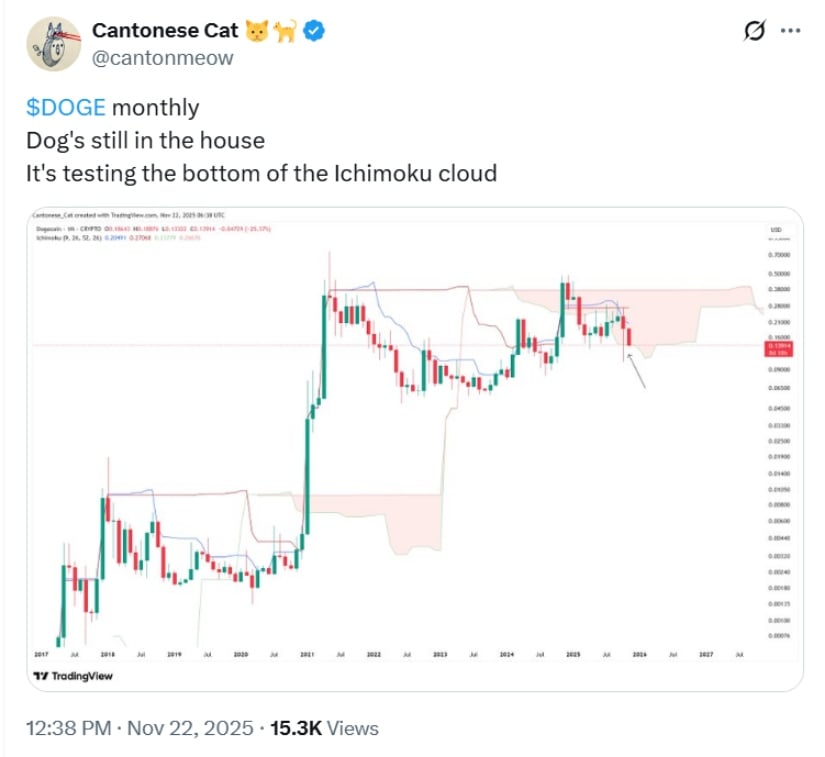
On the monthly chart, DOGE is currently testing the lower edge of the Ichimoku cloud—a key zone for long‑term support and momentum confirmation. Source: Cantonese Cat via X
Analysts also highlight the 0.5 logarithmic Fibonacci retracement and 200-week simple moving averages (SMAs) as additional long-term supports that could underpin rebounds toward $0.133 if broader market conditions improve. Cantonese Cat added a characteristically light remark—“Dog’s still in the house”—while emphasizing that DOGE remains within long-term structural support.
Key Levels and Risk Context
Analysts suggest the next potential resistance for DOGE could appear around $0.2000, provided critical support above $0.1500 holds.
On the downside, a sustained weekly close below $0.14 could open the path toward $0.07, contingent on volume expansion and confirmation below multi-year trendlines. Investors are advised to monitor consolidation patterns, trading volumes, and broader macro conditions, as these factors heavily influence the likelihood of both bullish and bearish outcomes.
Final Thoughts
Dogecoin remains in a cautious consolidation phase, with technical and historical support zones defining key thresholds.
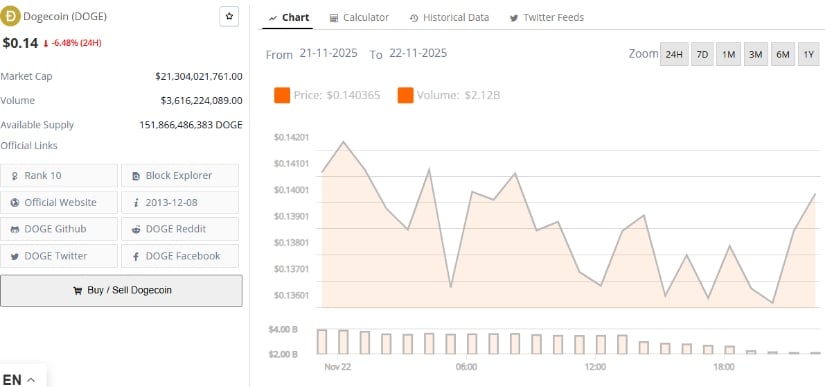
Dogecoin was trading at around 0.14, down 6.48% in the last 24 hours at press time. Source: Brave New Coin
While upside targets of $0.18–$0.20 are possible, they remain dependent on a confirmed breakout and market momentum. Conversely, failure to hold support could lead to testing lower macro levels. Traders and long-term investors should consider both scenarios while accounting for volume, volatility, and historical pattern behavior.


 24h Most Popular


 Utilities