

Rather than reacting to short-term volatility, traders and analysts are increasingly focused on confirmation signals across multiple timeframes. This has brought renewed attention to Ethereum’s evolving price structure, while placing prominent market voices—most notably Fundstrat’s Tom Lee—back into the discussion through a more data-driven lens.
Inverse Head-and-Shoulders Brings Focus to Ethereum Technical Analysis
A widely shared TradingView chart highlights a potential inverse head-and-shoulders formation on the ETH ($2,934.16)/USD pair, spanning the 2021 cycle peak through current consolidation, with forward projections extending into 2027. The pattern places its neckline near the $4,000 level, a zone that previously acted as resistance during earlier market phases.

The post outlines a long-term inverse head-and-shoulders pattern in ETH targeting $5,500–$6,500, alongside Tom Lee’s bullish outlook and mixed market reactions. Source: James via X
In classical technical analysis, a confirmed breakout above the neckline—typically accompanied by expanding volume—can imply a measured move based on the vertical distance from the pattern’s head to the neckline. In this case, that distance is approximately $1,500, yielding a theoretical target range between $5,500 and $6,500.
Market commentator James Easton captured the prevailing sentiment, stating:
“If $ETH pulls this off, Tom Lee will be the happiest man in finance.”
That said, professional analysts stress that pattern reliability varies by asset class and timeframe. Academic finance literature and crypto-specific backtesting studies published over the past decade generally place the success rate of inverse head-and-shoulders breakouts in the 65%–75% range, depending on confirmation criteria and market regime. As a result, most traders treat the pattern as a conditional signal rather than a forecast.
Tom Lee’s Ethereum Outlook Returns to Center Stage
The renewed technical focus has also revived discussion around earlier Ethereum price projections from Tom Lee, co-founder of Fundstrat Global Advisors. In a November 2025 outlook, Lee suggested ETH could revisit the $2,500 area before advancing toward a $7,000–$9,000 range by 2026.
Lee cited structural drivers such as layer-2 network scaling, rising on-chain activity, and expected inflows from spot Ethereum ETF products. A subsequent update in December adopted a more aggressive tone, though even Lee has historically acknowledged that long-range crypto forecasts carry wide confidence bands.
Market participants note that while Lee’s bullish calls have often aligned with broader adoption trends, their timing accuracy has varied across prior Ethereum cycles. For this reason, institutional desks tend to contextualize such projections alongside positioning data, derivative funding rates, and macro liquidity conditions rather than treating them as standalone signals.
Long-Term Conviction Highlighted by Dormant ICO Wallet Activity
Beyond price charts, on-chain data has provided tangible evidence of long-term conviction. Blockchain analytics platform Lookonchain recently identified the movement of 2,000 ETH from a wallet originating in Ethereum’s 2014 ICO, marking its first activity in over 10 years.

A 2014 Ethereum ICO wallet moved 2,000 ETH worth $5.85M, showcasing long-term returns and community praise for patient holding. Source: Solid 堅固 ⬡ via X
The wallet initially acquired ETH at approximately $0.31 per token, with a total cost near $620. At prices around $2,925 at the time of transfer, the holdings were valued at roughly $5.85 million—a realized return of more than 9,400x.
Analysts view such events less as market signals and more as structural reminders of Ethereum’s long-term adoption curve. Similar dormant-wallet activations have historically occurred near periods of reduced volatility rather than major market tops, reinforcing the distinction between patient capital and short-term speculative flows often highlighted in daily Ethereum news.
Ethereum Price Analysis Shows Gradual Recovery Structure
From a short-term perspective, Ethereum price analysis points to a cautiously improving setup. On the 4-hour timeframe, ETH continues to respect an ascending trendline formed after the most recent corrective phase, while consistently printing higher lows.
The $2,920 level has acted as a recurring support zone over the past several weeks. ETH has also remained above the Ichimoku cloud on this timeframe, a condition that technicians often interpret as a reduction in downside momentum rather than a confirmed uptrend.

ETH is showing early recovery, holding above the $2,920 support and ascending trendline, with short-term consolidation likely before a potential move toward $3,070. Source: Paradise_Noir on TradingView
If this structure remains intact, analysts expect consolidation to continue before a possible test of the $3,070 resistance area. Importantly, professional traders typically treat pullbacks within such structures as neutral retracements unless key supports fail.
Range-Bound Market Keeps Ethereum Outlook Balanced
Despite localized strength, Ethereum remains range-bound on higher timeframes. Repeated rejections between $3,040 and $3,080 indicate persistent supply, while demand remains visible near the $2,780–$2,820 zone.

ETH is range-bound on the 4H chart, with support at $2,780–$2,820 and resistance at $3,040–$3,080; neutral to slightly bullish, awaiting a breakout or breakdown. RexTraderGOLD on TradingView
Market participants generally describe this environment as neutral to slightly constructive. A decisive 4-hour close above resistance—ideally supported by volume and declining funding-rate leverage—would be viewed as confirmation of upside expansion. Conversely, a sustained break below the lower support band would likely invalidate the near-term bullish thesis.
This equilibrium reflects broader market conditions, where Bitcoin strength and stable macro indicators have yet to trigger sustained capital rotation into altcoins.
Whale Cost Basis Adds Context to Ethereum Price Prediction
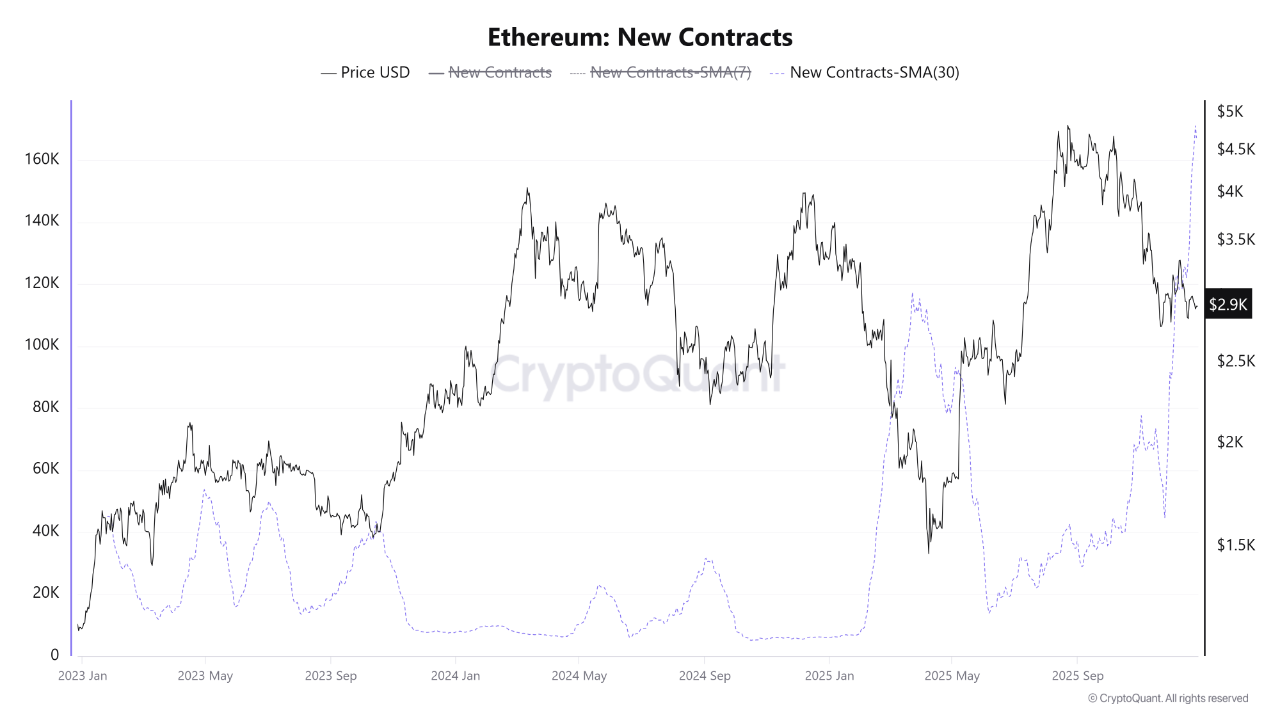
On-chain positioning further contextualizes Ethereum price prediction models. Data from CryptoQuant indicates that large holders are actively defending a realized price near $2,796, representing the average acquisition cost for long-term whale cohorts.

Ethereum whales are defending their cost basis, accumulating 4.8M ETH since Nov 21, keeping strong support near $2.8K. Source: Kapoor Kshitiz via X
Since late November, these addresses have accumulated approximately 4.8 million ETH, increasing their collective holdings to around 27.2 million ETH. At recent prices, this translates to roughly $4.8 billion in unrealized gains.
Historically, the defense of realized price levels by long-term holders has reduced downside volatility during consolidation phases. However, analysts also flag risk stemming from leverage. Ethereum’s estimated leverage ratio recently reached a six-month high on a rolling basis, signaling increased borrowed exposure relative to spot holdings.
Without a clear macro catalyst, elevated leverage raises the probability of sharp liquidations if sentiment reverses.
Outlook Remains Data-Driven, Not Guaranteed
While technical structures, whale behavior, and long-term conviction indicators are aligning more constructively, analysts emphasize that Ethereum price prediction remains probabilistic rather than directional.

Ethereum was trading at around 2,928.09, down 1.31% in the last 24 hours at press time. Source: Ethereum price via Brave New Coin
A sustained bullish case depends on confirmation above resistance zones, continued defense of key cost bases, and controlled leverage conditions. Failure at these levels would likely reset expectations toward further consolidation rather than trend continuation.
For now, Ethereum appears to be in a transitional phase—supported by adoption fundamentals and long-term holder confidence, yet constrained by liquidity dynamics and risk management considerations. The focus has shifted from ambitious targets to whether Ethereum can consistently convert structural resilience into durable momentum.


 24h Most Popular


 Utilities