
Ethereum price fell nearly 11.5% over the past 24 hours. It has since recovered roughly 2.5%, now trading above $3,230. Yet, the 24-hour ticker still shows a near 6% dip.
The corrective move, however, has printed a bullish reversal pattern on the chart, but the question is whether it can play out while large holders continue to step back.
Reversal Pattern Appears, but Whale Activity Still Shows Weakness
Ethereum has formed a bullish harami on the daily chart. This pattern happens when a small green candle sits inside the body of a larger red candle from the previous day. It often shows selling pressure slowing and buyers trying to regain control.
A similar setup appeared on November 5, but the bounce failed because buying strength faded quickly. That failure puts more weight on the current pattern and whether buyers can sustain momentum this time.
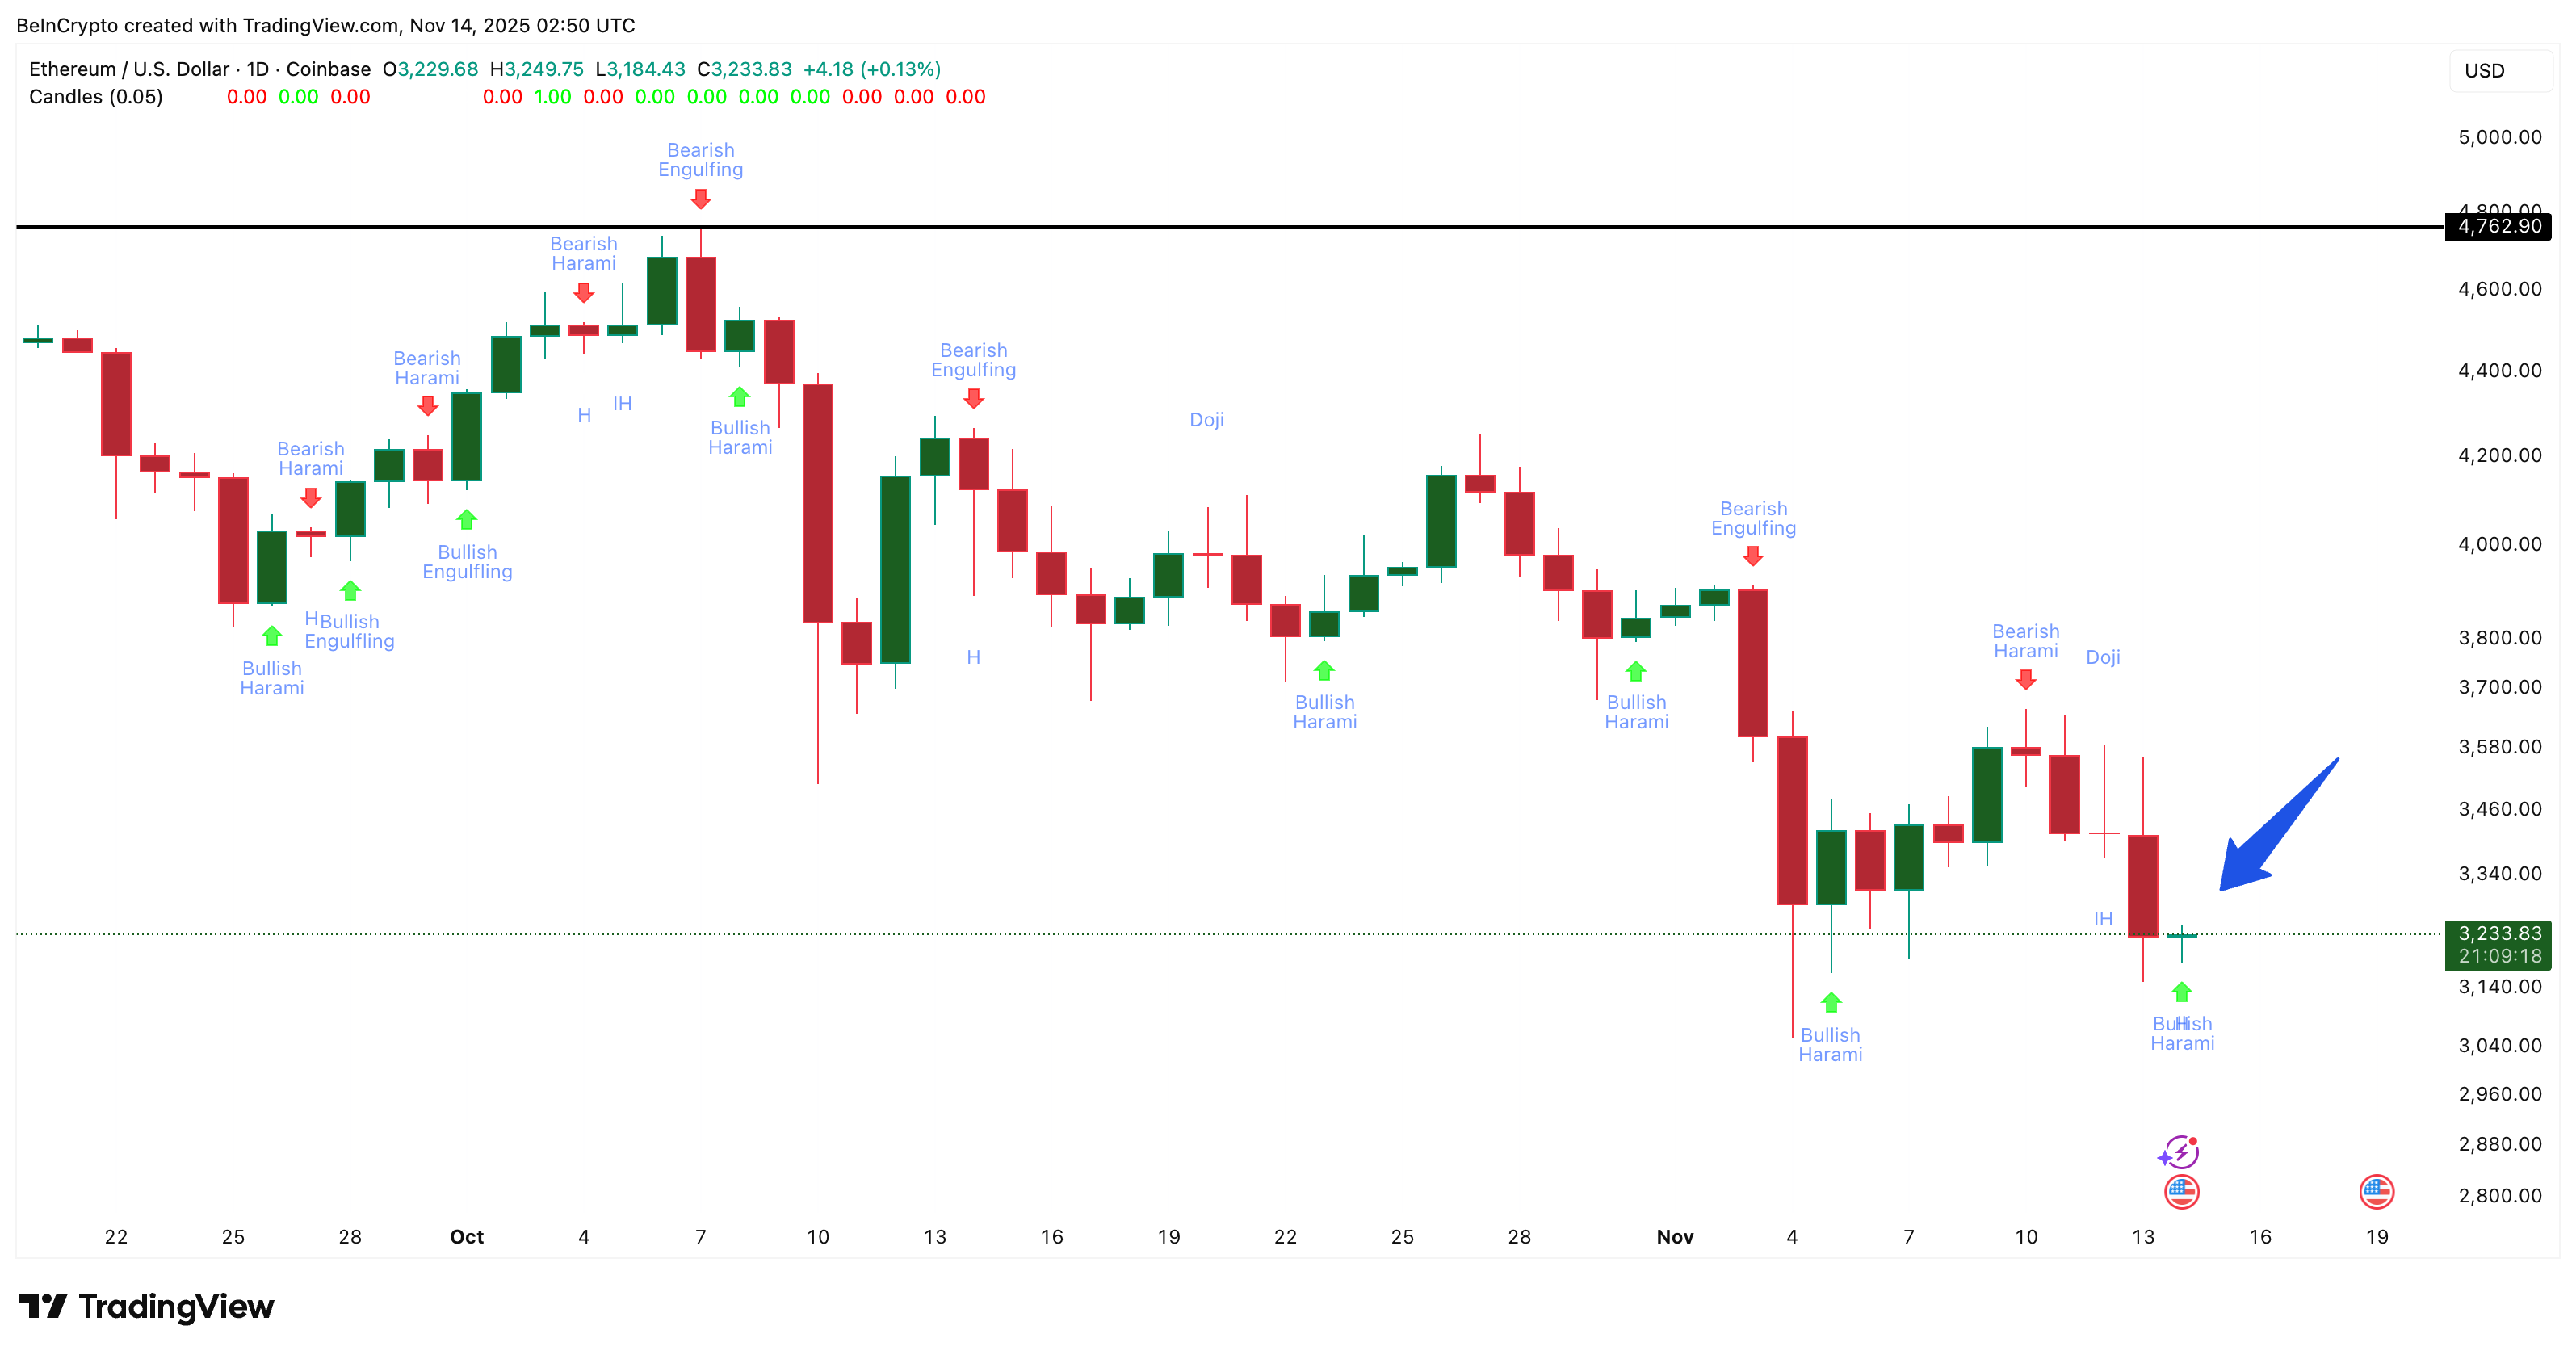 Bullish Pattern Identified: TradingView
Want more token insights like this? Sign up for Editor Harsh Notariya’s Daily Crypto Newsletter here.
The pressure comes from whale behavior. The mega-whale address count, which tracks the 30-day change in wallets holding over 10,000 ETH ($3,222.66), has dropped again. It is now back to the same negative level seen on November 8.
The number of addresses holding 10k ETH has also been falling since November 2. There was a small pickup from November 6 to 11 during a short-lived rebound, but the decline returned immediately after. That decline in holdings coincided with Ethereum’s bearish crossover, a risk we highlighted earlier.
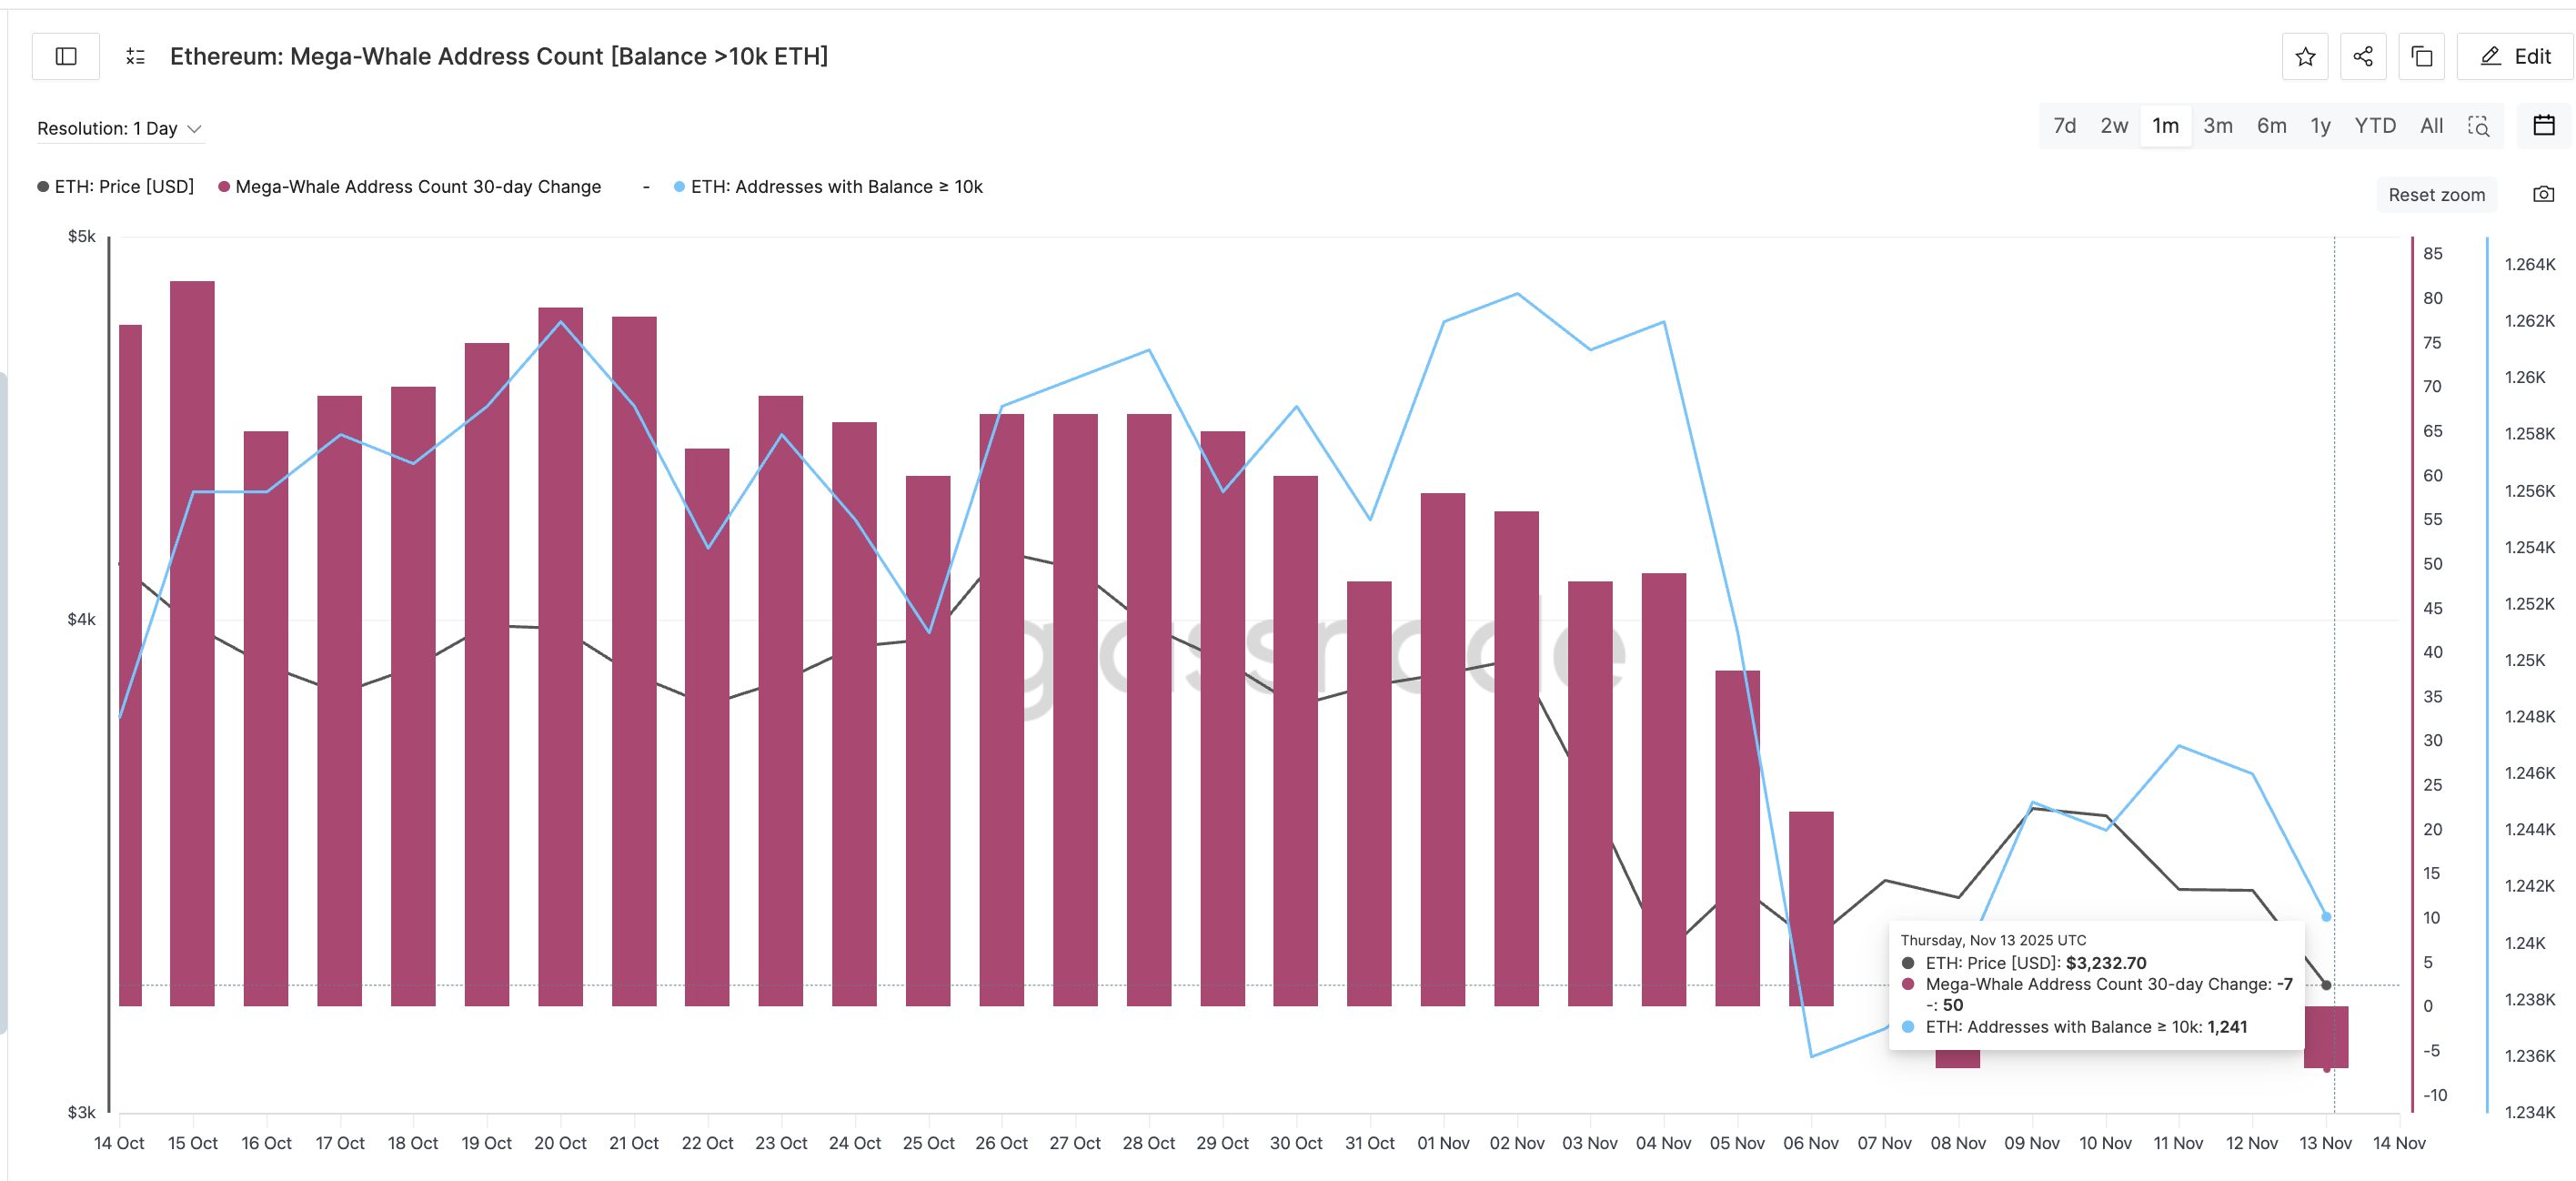 Mega ETH Whales Not Convinced: Glassnode
So even though the bullish harami is active, whales are not supporting the move yet. That keeps the Ethereum price reversal setup weaker than it looks on the chart.
Key Levels Now Decide Whether the Ethereum Price Reversal Expands or Fades
If the bullish pattern holds, Ethereum’s next test sits near $3,333, a short-term level that has limited rebounds this week. That level is mentioned later when we discuss the Ethereum price chart.
The stronger hurdle is $3,650, which requires a 12% move from the recent low. Data from the cost-basis distribution heatmap, a tool that maps where large amounts of ETH last changed hands, shows that $3,638–$3,667 holds one of the biggest supply zones.
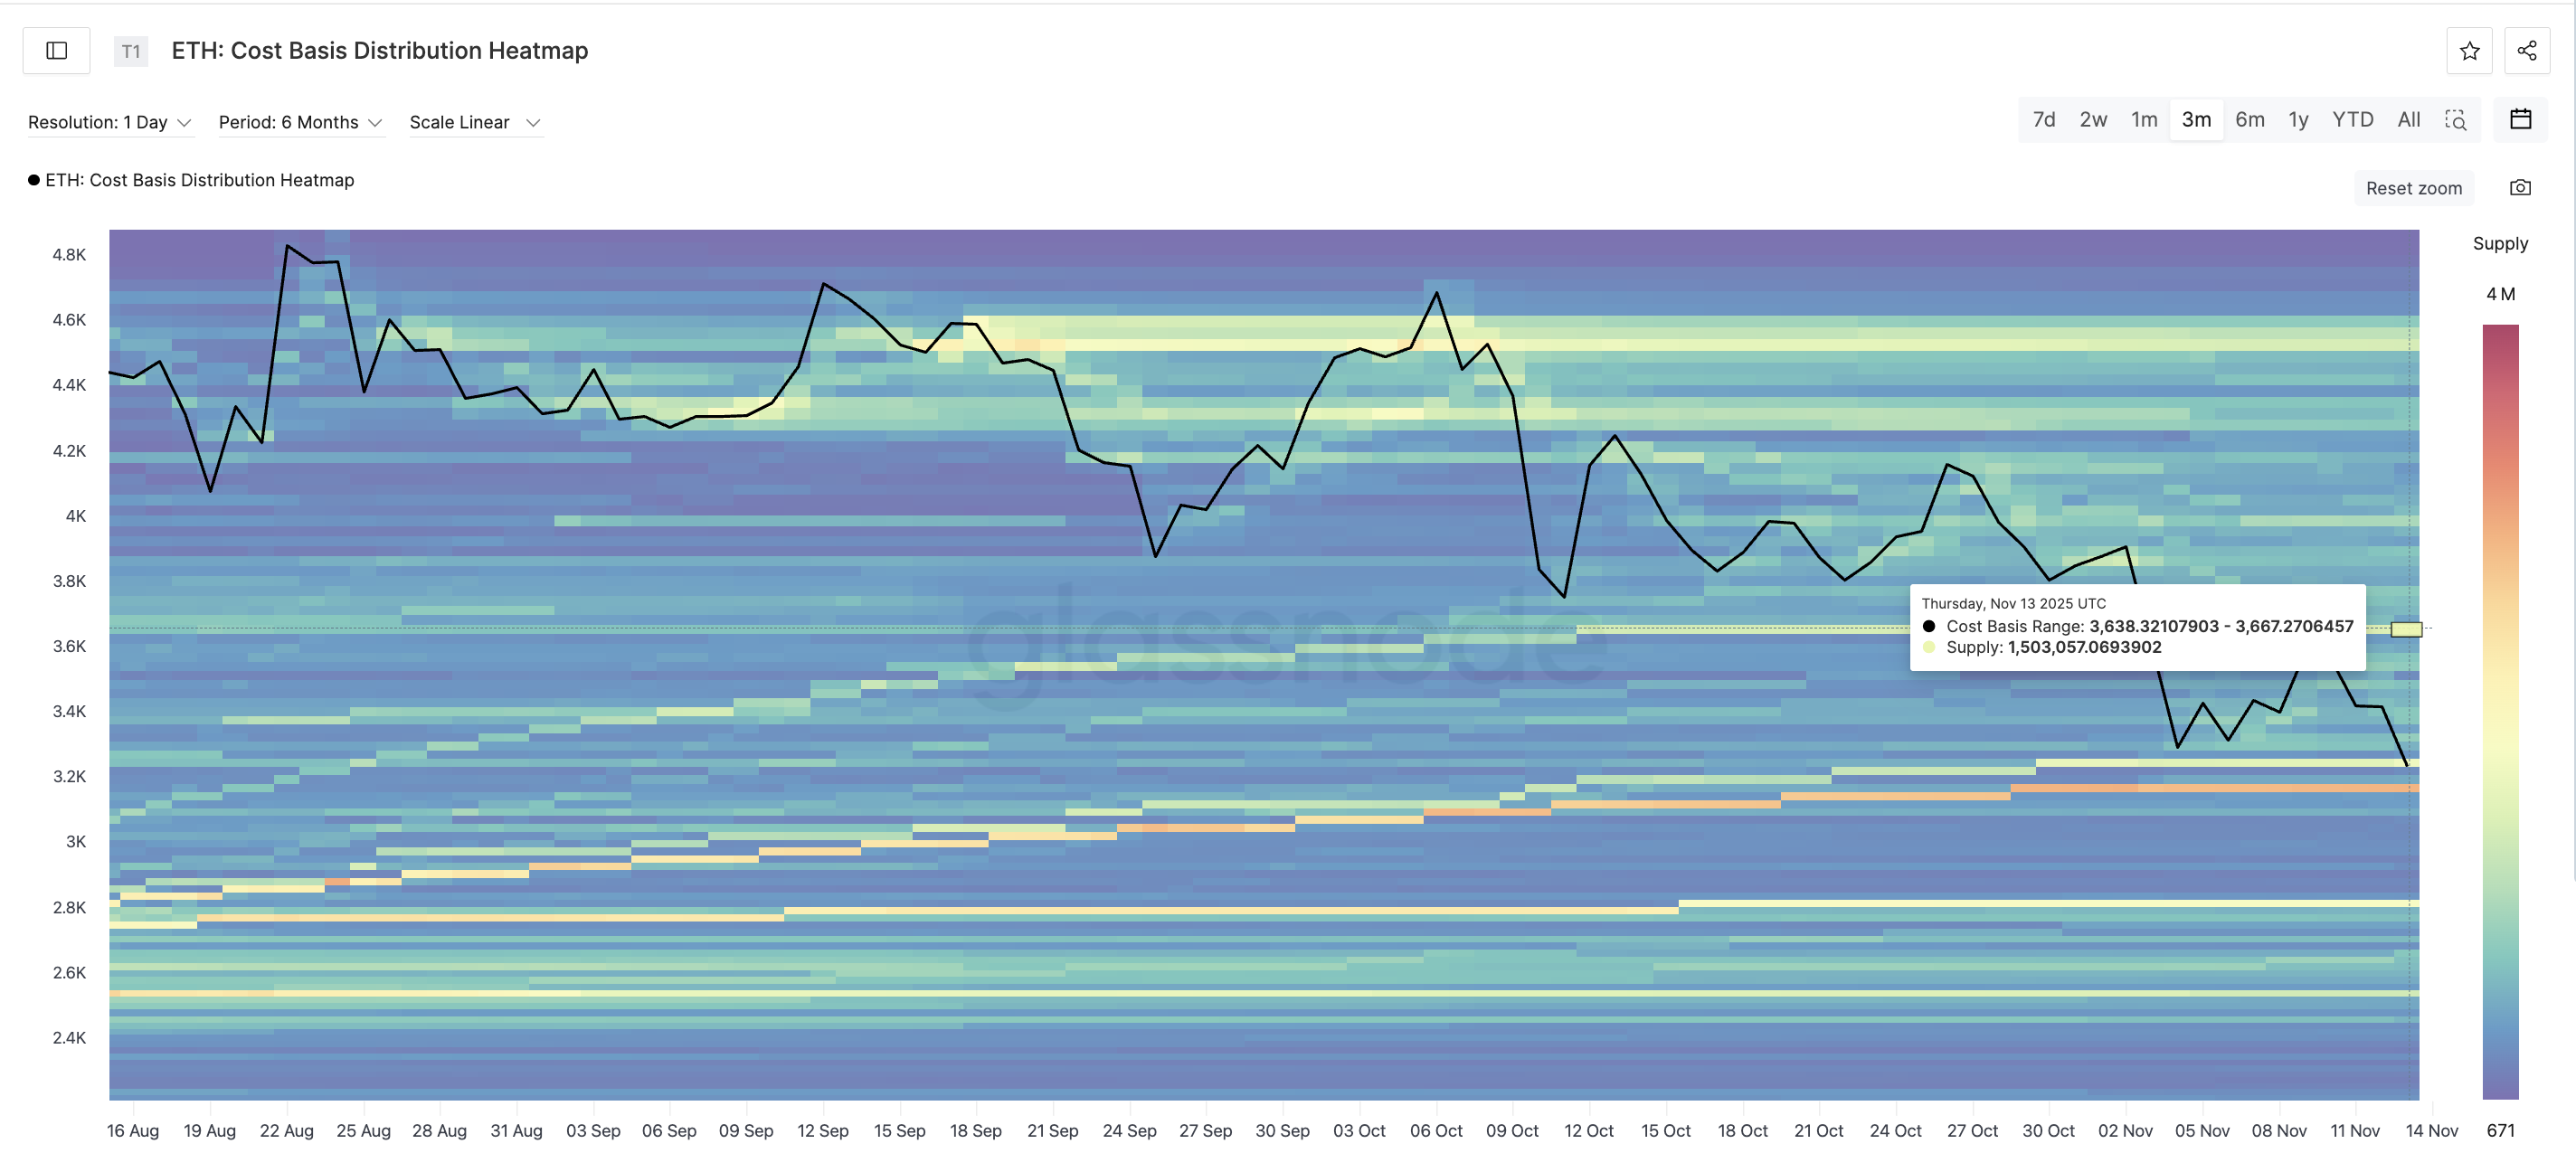 Ethereum Supply Cluster: Glassnode
It contains more than 1.5 million ETH, so clearing it would show strong buyer commitment. This is why the $3,650 level becomes all the more important.
A close above this band would confirm that the bullish harami is working and could open a broader recovery. But if the Ethereum price loses support near $3,150, the pattern weakens fast.
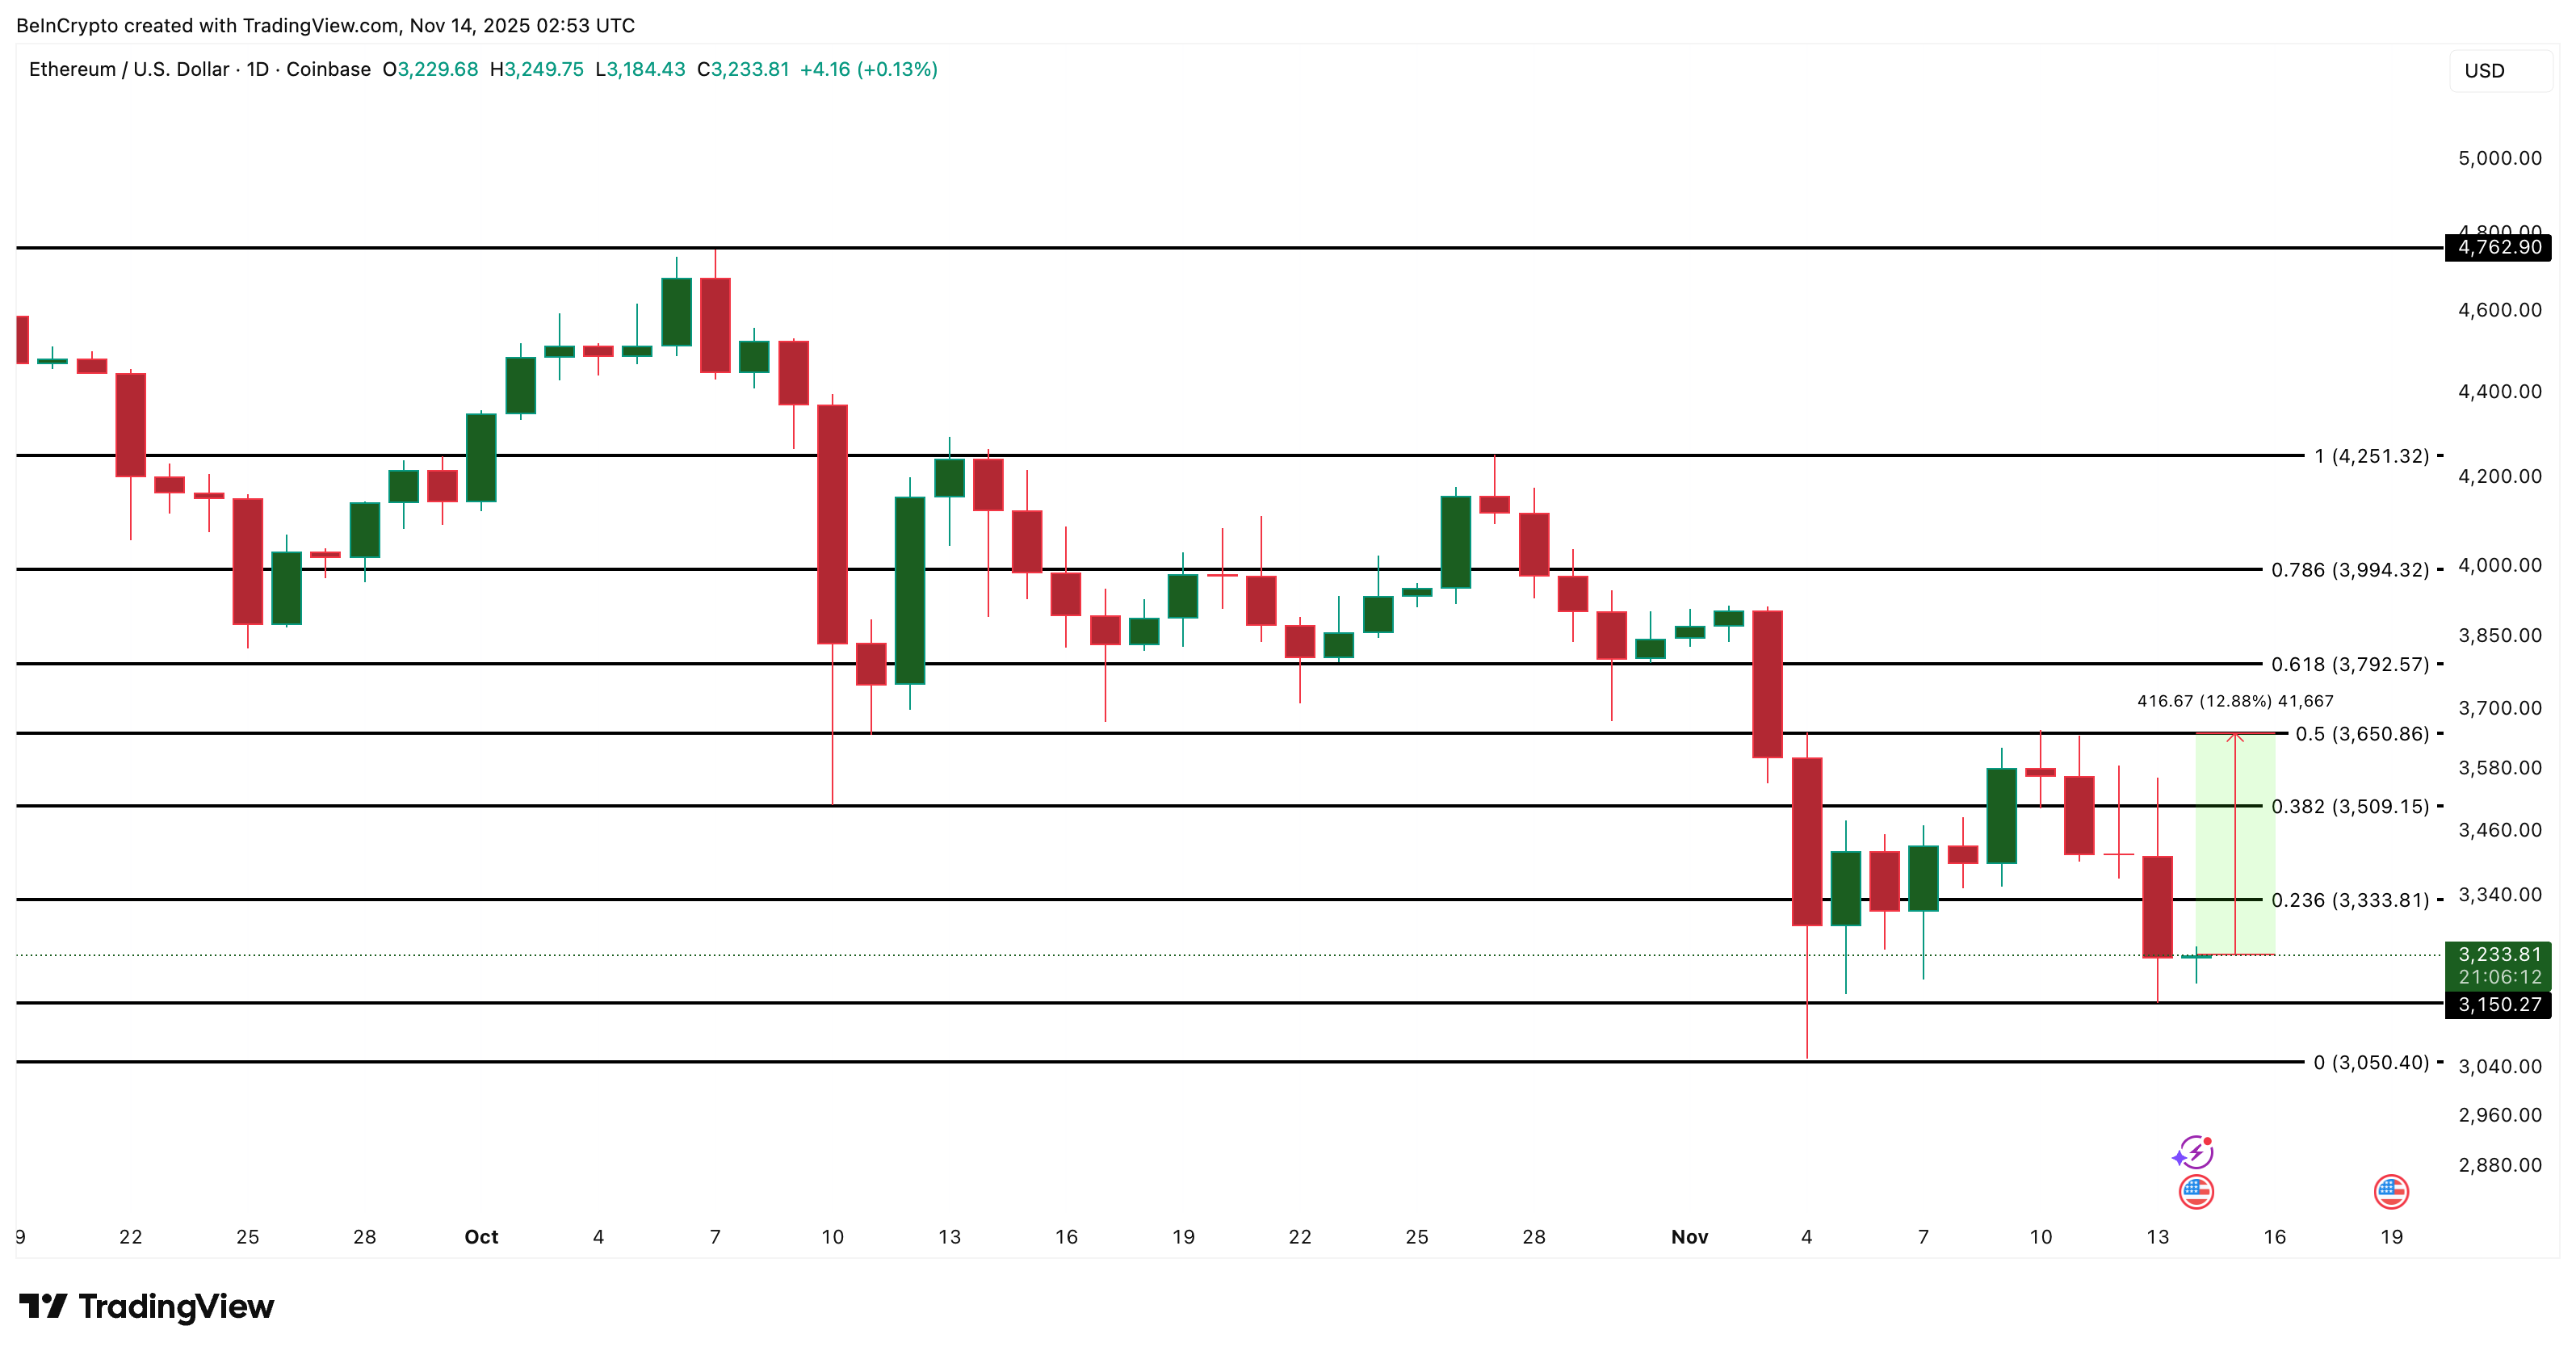 Ethereum Price Analysis: TradingView
A sharp drop below $3,050 would invalidate the structure and allow sellers to push lower, repeating what happened after the failed harami earlier this month.
The post Ethereum Flashes a Reversal Setup — Now It Just Needs the ‘Mega’ Confirmation appeared first on BeInCrypto.


 24h Most Popular


 Utilities