Ethereum price failed to stay above $3,000 and tested $2,870. ETH ($3,019.44) is now attempting to recover but faces resistance near $3,100.
- Ethereum started a fresh decline after it failed to stay above $3,050.
- The price is trading below $3,100 and the 100-hourly Simple Moving Average.
- There is a key bearish trend line forming with resistance at $3,100 on the hourly chart of ETH/USD (data feed via Kraken).
- The pair could continue to move down if it settles below the $3,000 zone.
Ethereum Price Faces Hurdles
Ethereum price failed to continue higher above $3,150 and started a fresh decline, like Bitcoin. ETH price dipped below $3,050 and entered a bearish zone.
The decline gathered pace below $3,000 and the price dipped below $2,950. A low was formed at $2,870 and the price is now correcting some losses. There was a move above the 50% Fib retracement level of the recent decline from the $3,165 swing high to the $2,870 low.
Ethereum price is now trading below $3,100 and the 100-hourly Simple Moving Average. If there is another recovery wave, the price could face resistance near the $3,050 level and the 61.8% Fib retracement level of the recent decline from the $3,165 swing high to the $2,870 low.
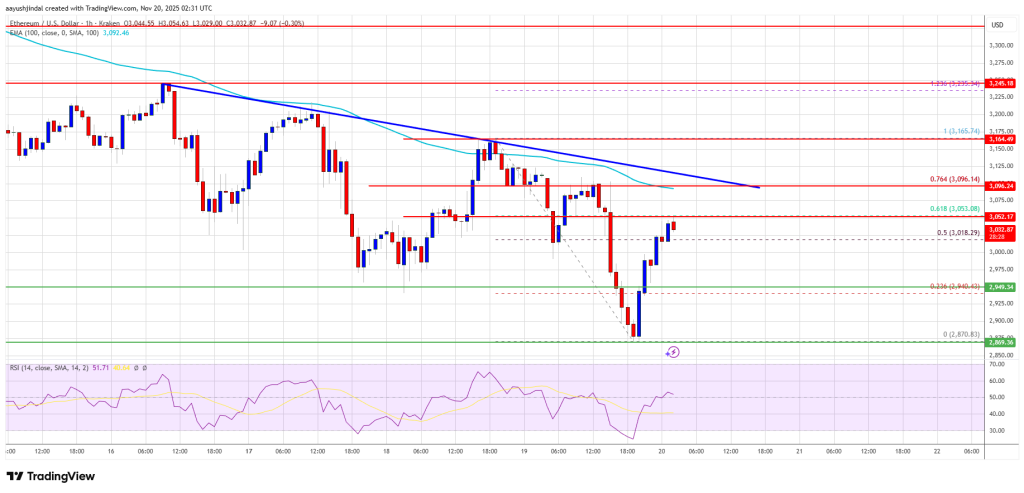
The next key resistance is near the $3,100 level. There is also a key bearish trend line forming with resistance at $3,100 on the hourly chart of ETH/USD. The first major resistance is near the $3,150 level. A clear move above the $3,150 resistance might send the price toward the $3,200 resistance. An upside break above the $3,200 region might call for more gains in the coming days. In the stated case, Ether could rise toward the $3,320 resistance zone or even $3,350 in the near term.
Another Drop In ETH?
If Ethereum fails to clear the $3,100 resistance, it could start a fresh decline. Initial support on the downside is near the $3,000 level. The first major support sits near the $2,940 zone.
A clear move below the $2,940 support might push the price toward the $2,880 support. Any more losses might send the price toward the $2,820 region in the near term. The next key support sits at $2,750 and $2,740.
Technical Indicators
Hourly MACD – The MACD for ETH/USD is losing momentum in the bearish zone.
Hourly RSI – The RSI for ETH/USD is now above the 50 zone.
Major Support Level – $3,000
Major Resistance Level – $3,100


 24h Most Popular


 Utilities