
HBAR ($0.17) price is down almost 1% today and has traded flat over the past month. It is up 5.7% in the last seven days, but that bounce does not change the bigger picture.
The chart is close to forming a bearish structure that points to a deeper drop unless one level holds.
Bearish Pattern Forms as Two Risks Amplify
HBAR is close to completing a head-and-shoulders pattern on the daily chart. If price slips below the neckline, the setup signals a potential 28% decline. This pattern is not confirmed yet, but it sits near completion — and the next moves depend heavily on volume behavior.
Want more token insights like this? Sign up for Editor Harsh Notariya’s Daily Crypto Newsletter here.
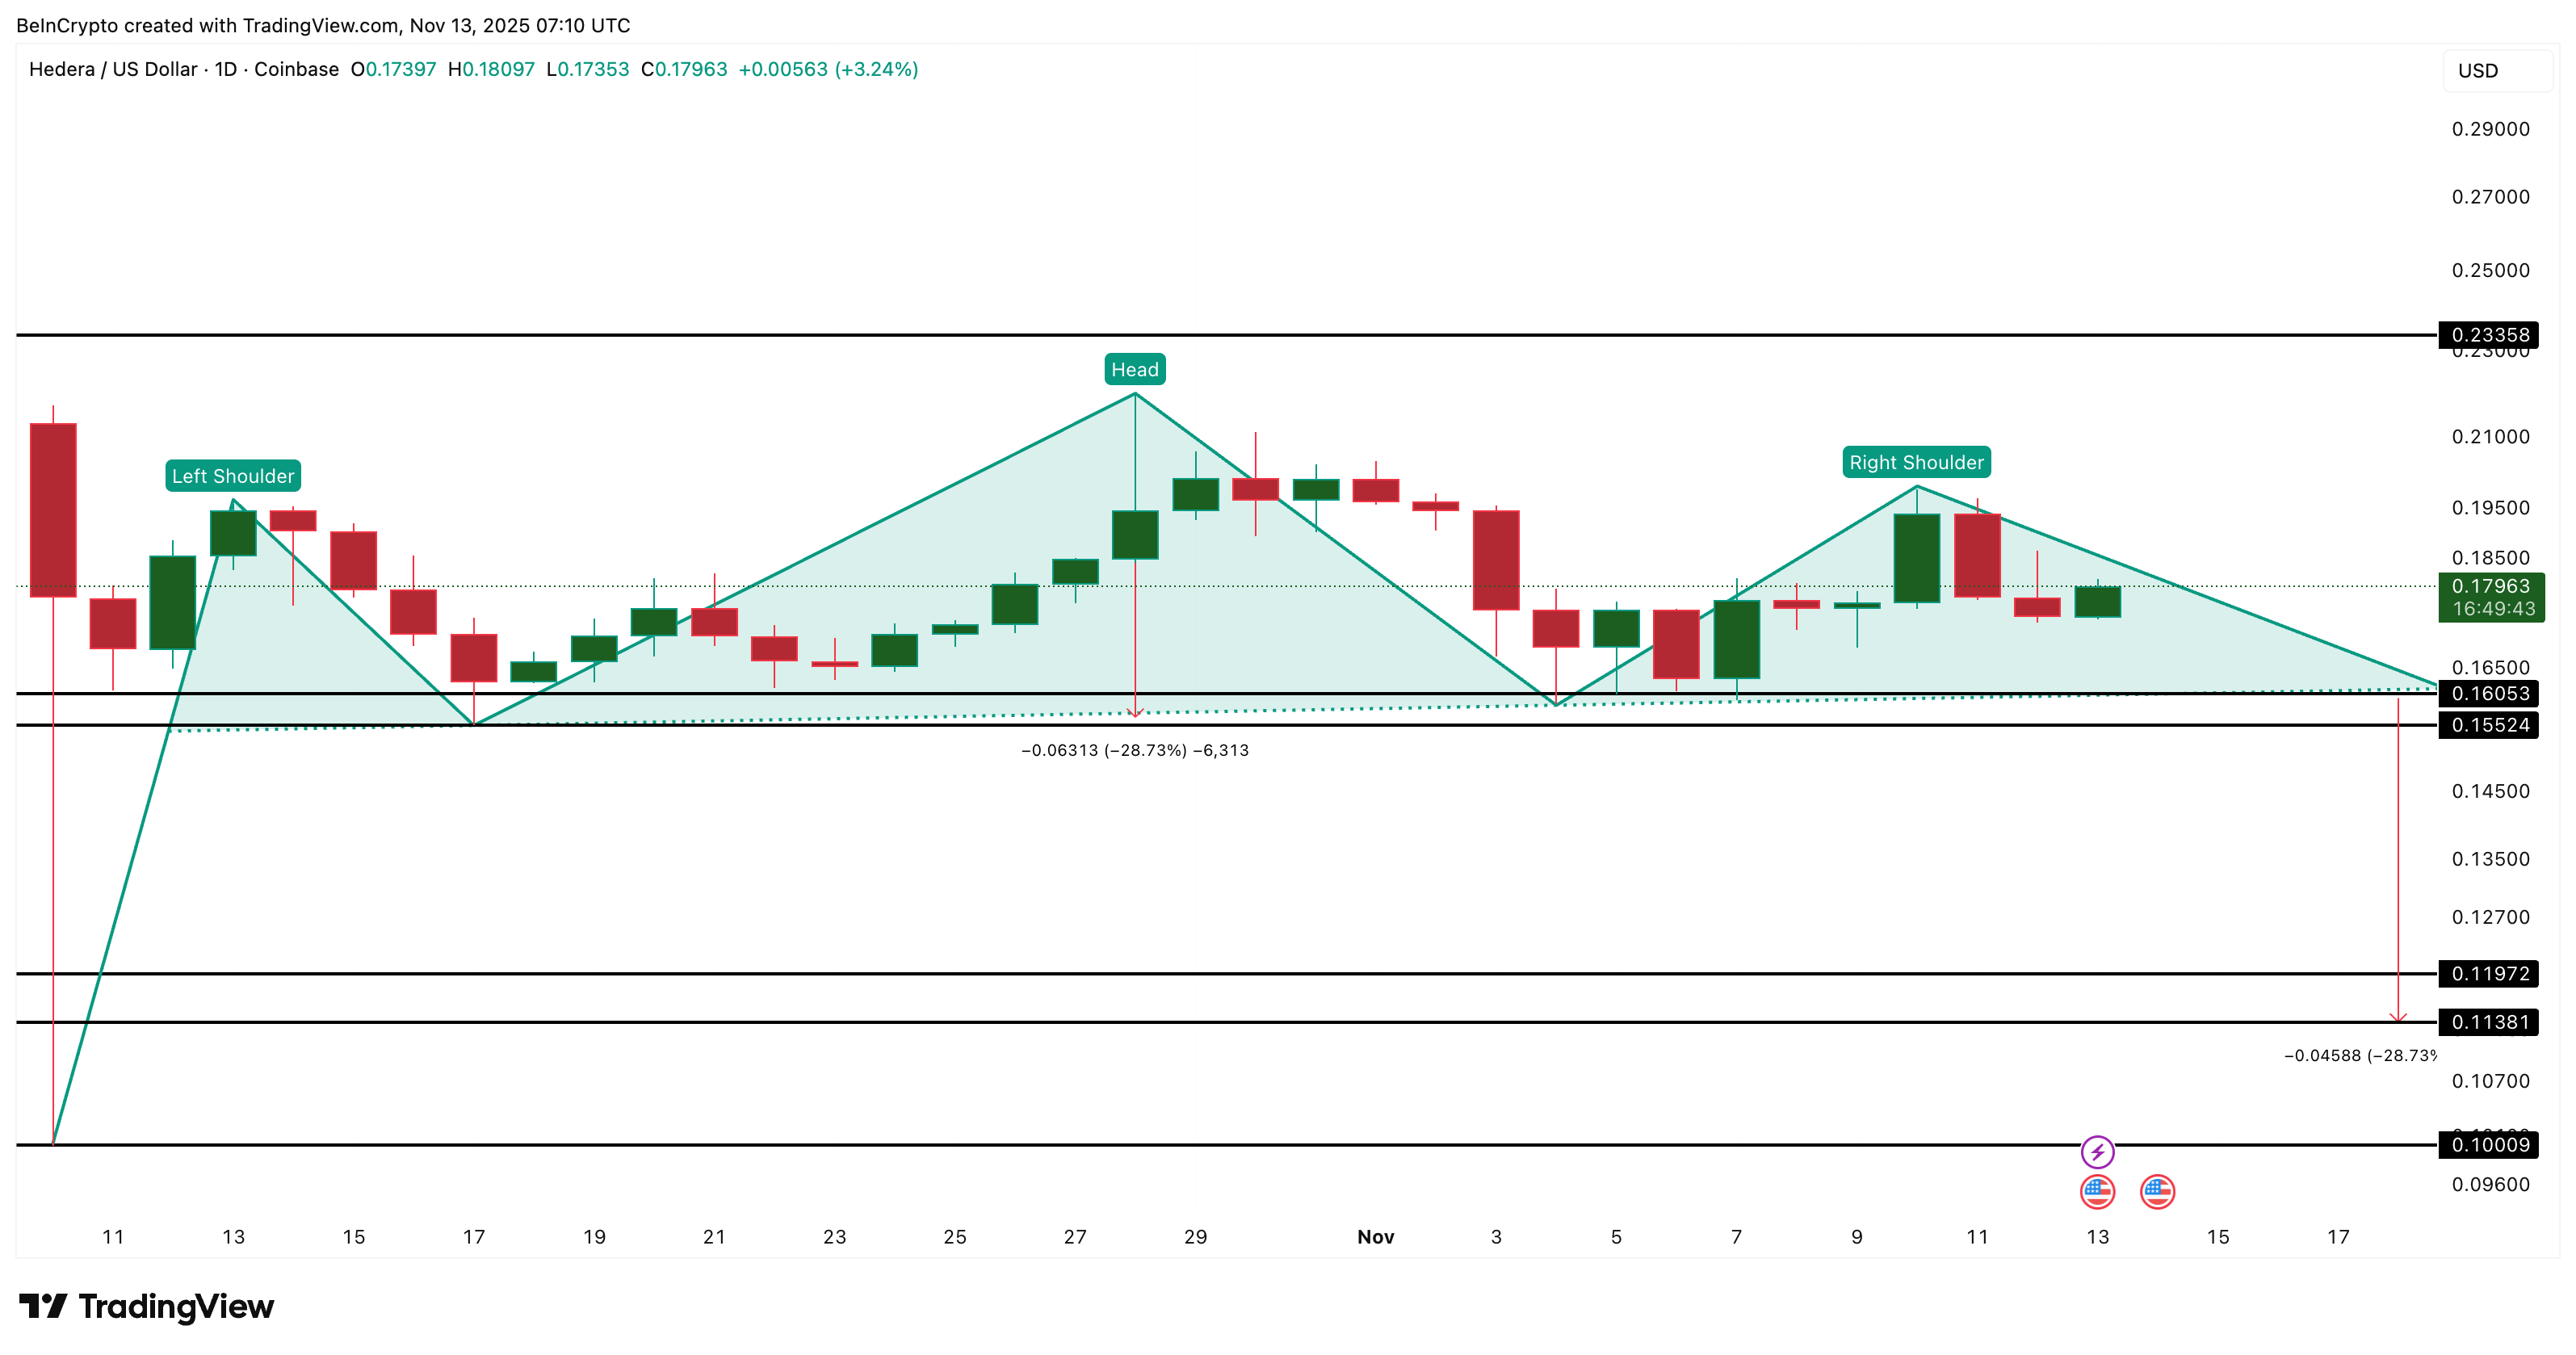 Head And Shoulders Pattern At Work: TradingView
That brings the focus to On-Balance Volume (OBV), a tool that tracks whether volume is flowing into or out of the asset. OBV has been rising slowly along an ascending trendline since 23 October, but this is not a strong signal.
Each time OBV drifts toward the lower edge of this trendline, HBAR price pulls back, showing that buyers are barely holding momentum. OBV is now back at the edge again, which increases the risk of a breakdown. If OBV slips under this line, the head-and-shoulders setup gains momentum.
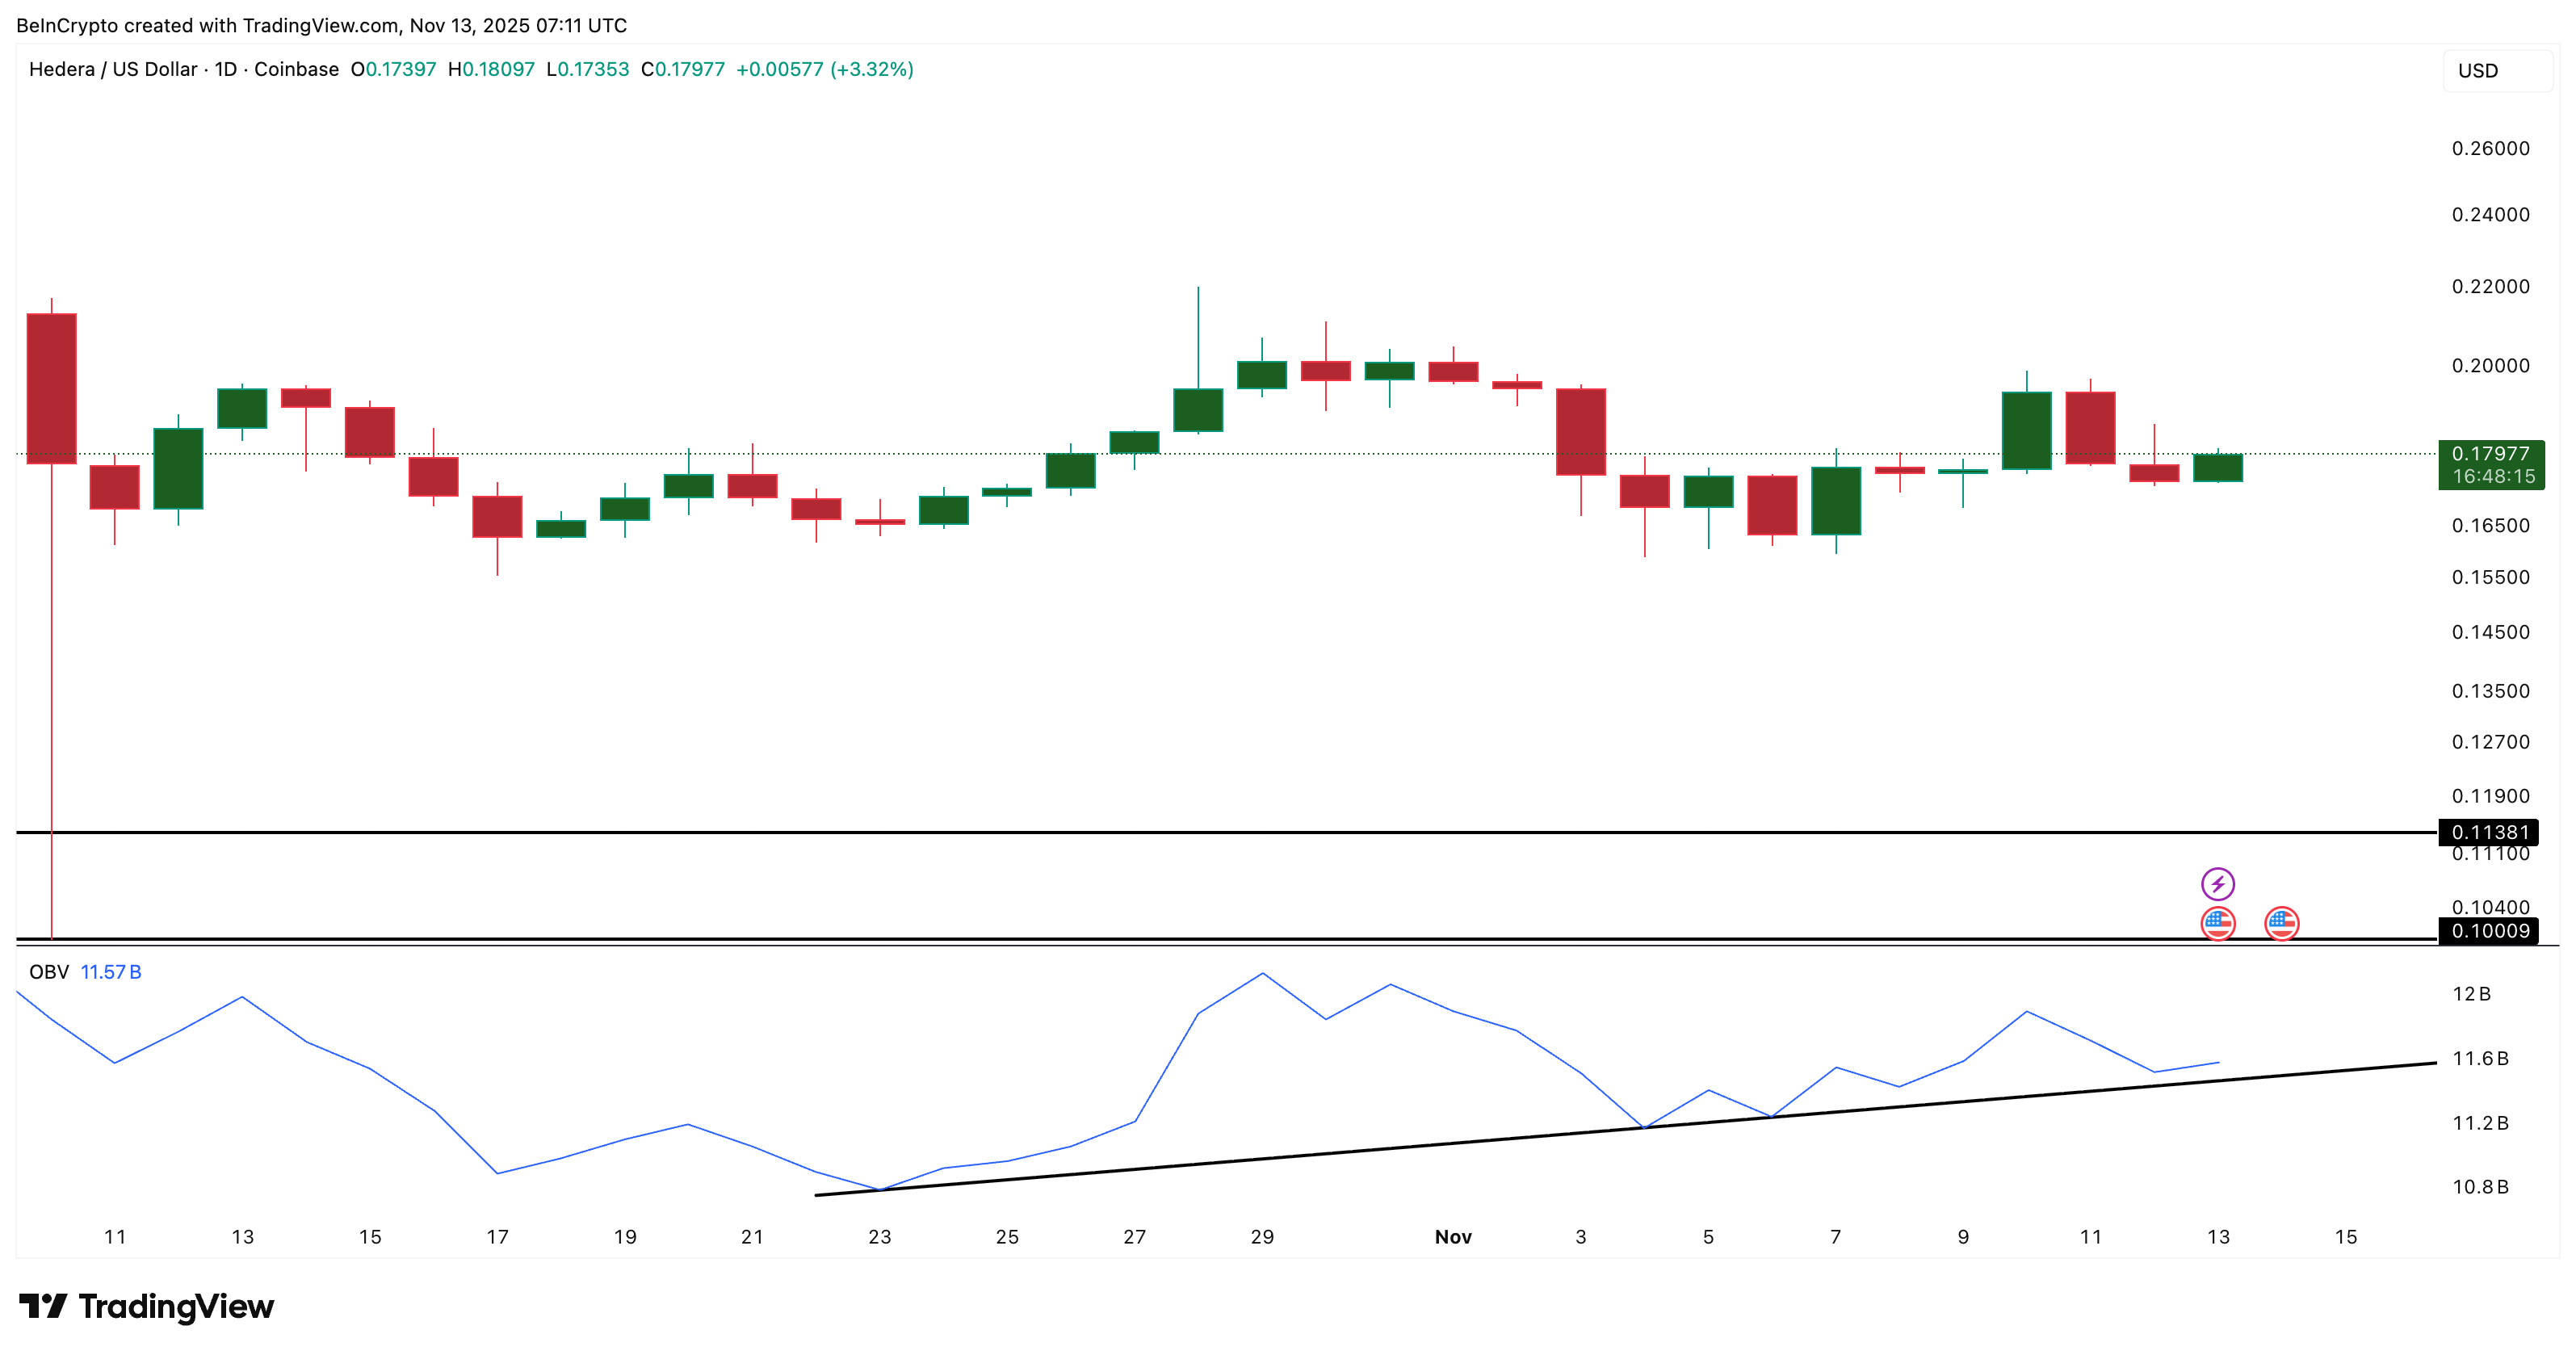 HBAR Needs Volume Support To Avoid Crash: TradingView
A second risk comes from the leverage map. Over the past seven days on Bitget alone:
- Long liquidations: 17.95 million
- Short liquidations: 14.34 million
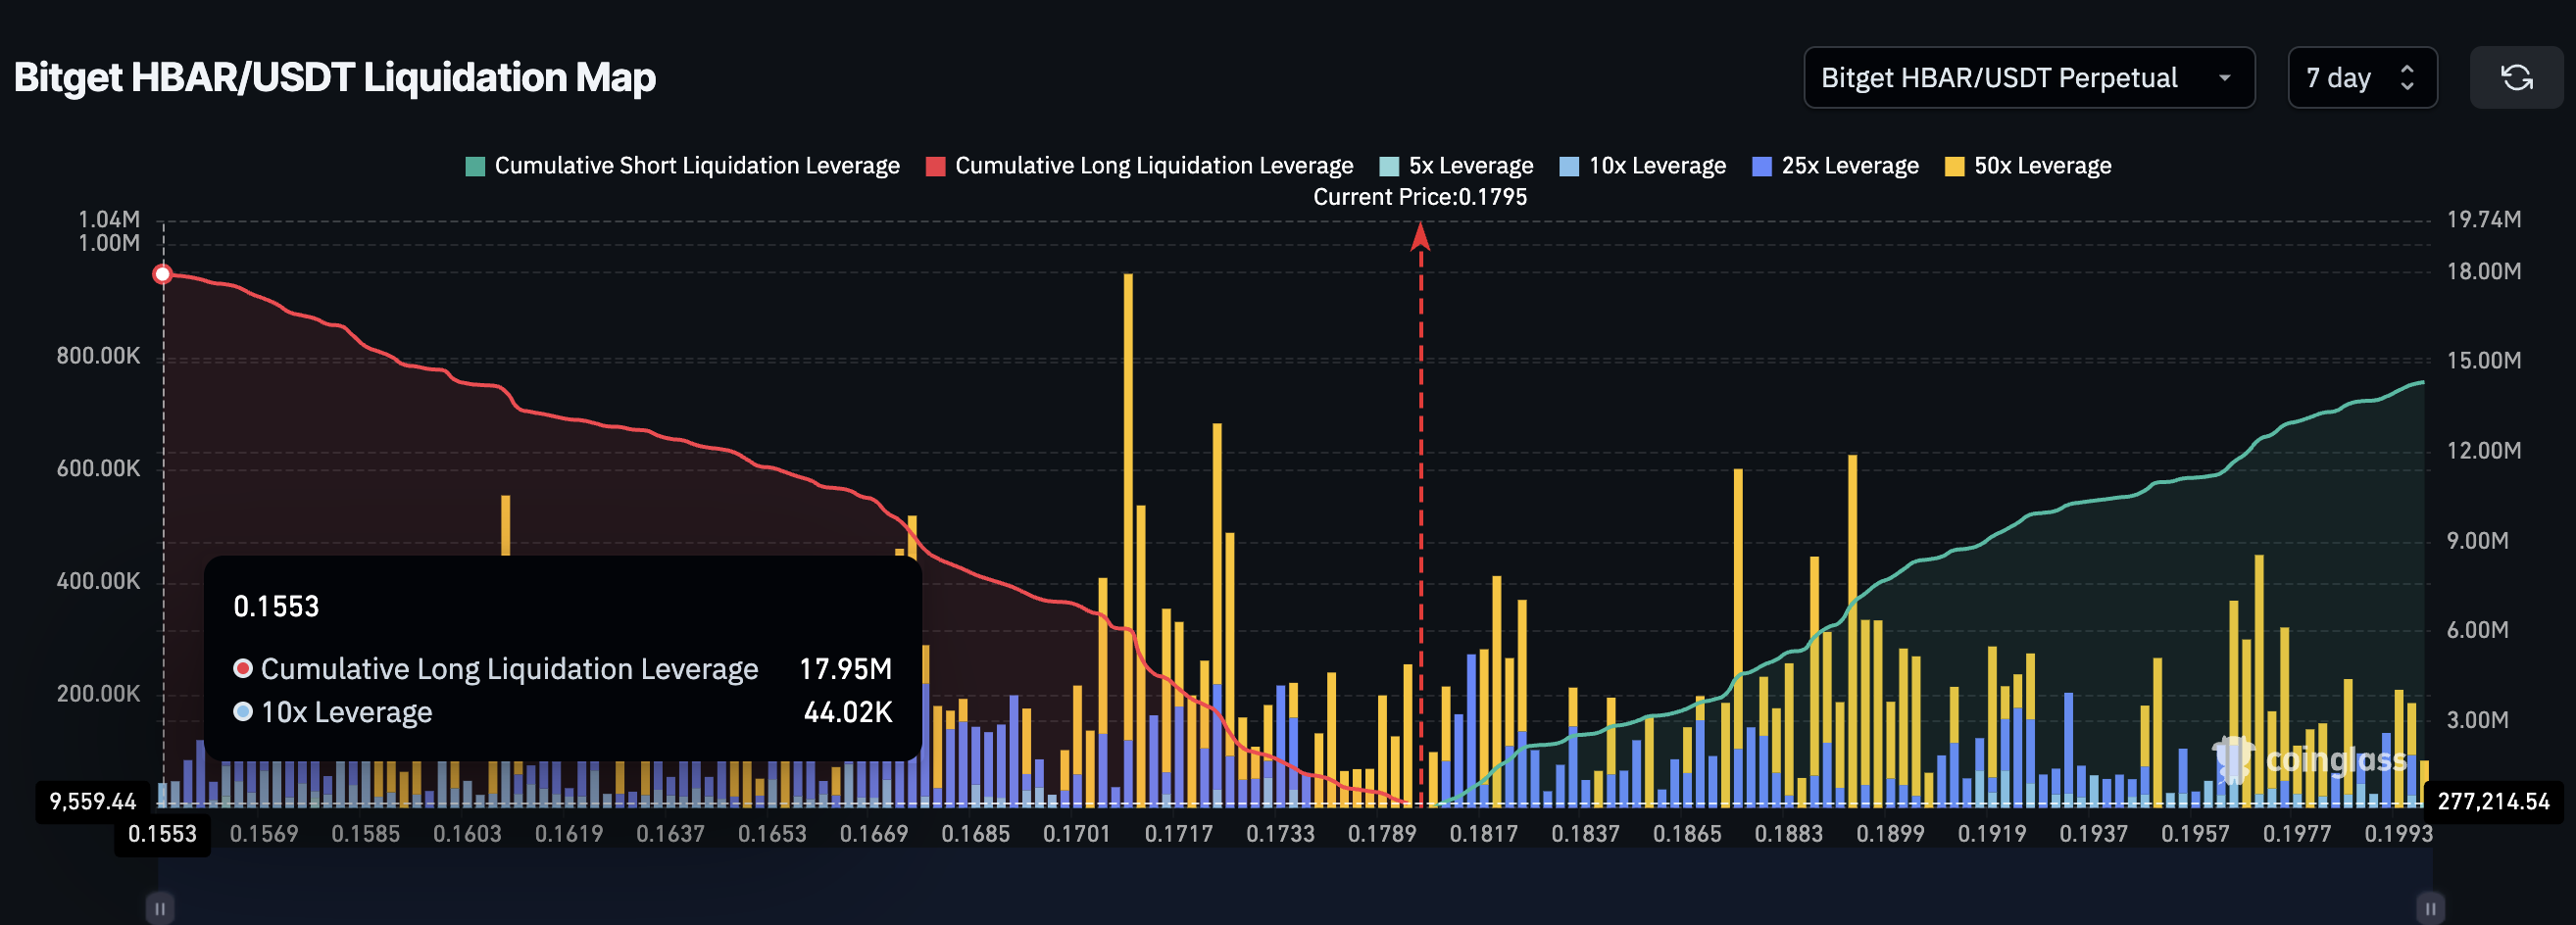 Long Squeeze Risk Exists: Coinglass
Longs outweigh shorts by almost 25%, which leaves the market exposed. If price reaches the neckline, led by weak OBV, a long squeeze could kick in, accelerating the downside.
Key Levels Now Decide Whether HBAR Price Drops or Escapes
HBAR now comes down to two paths:
Bearish path (likely if the neckline breaks): The neckline of the head-and-shoulders pattern sits near $0.160. A clean drop below it completes the structure and exposes a 28% fall, with the HBAR price chart pointing toward $0.113 and even $0.100 if long liquidations cascade.
Bullish path (only if reclaimed): A recovery starts only if HBAR reclaims $0.199 with strength. A full invalidation happens at $0.219, which erases the pattern and shifts momentum back to buyers.
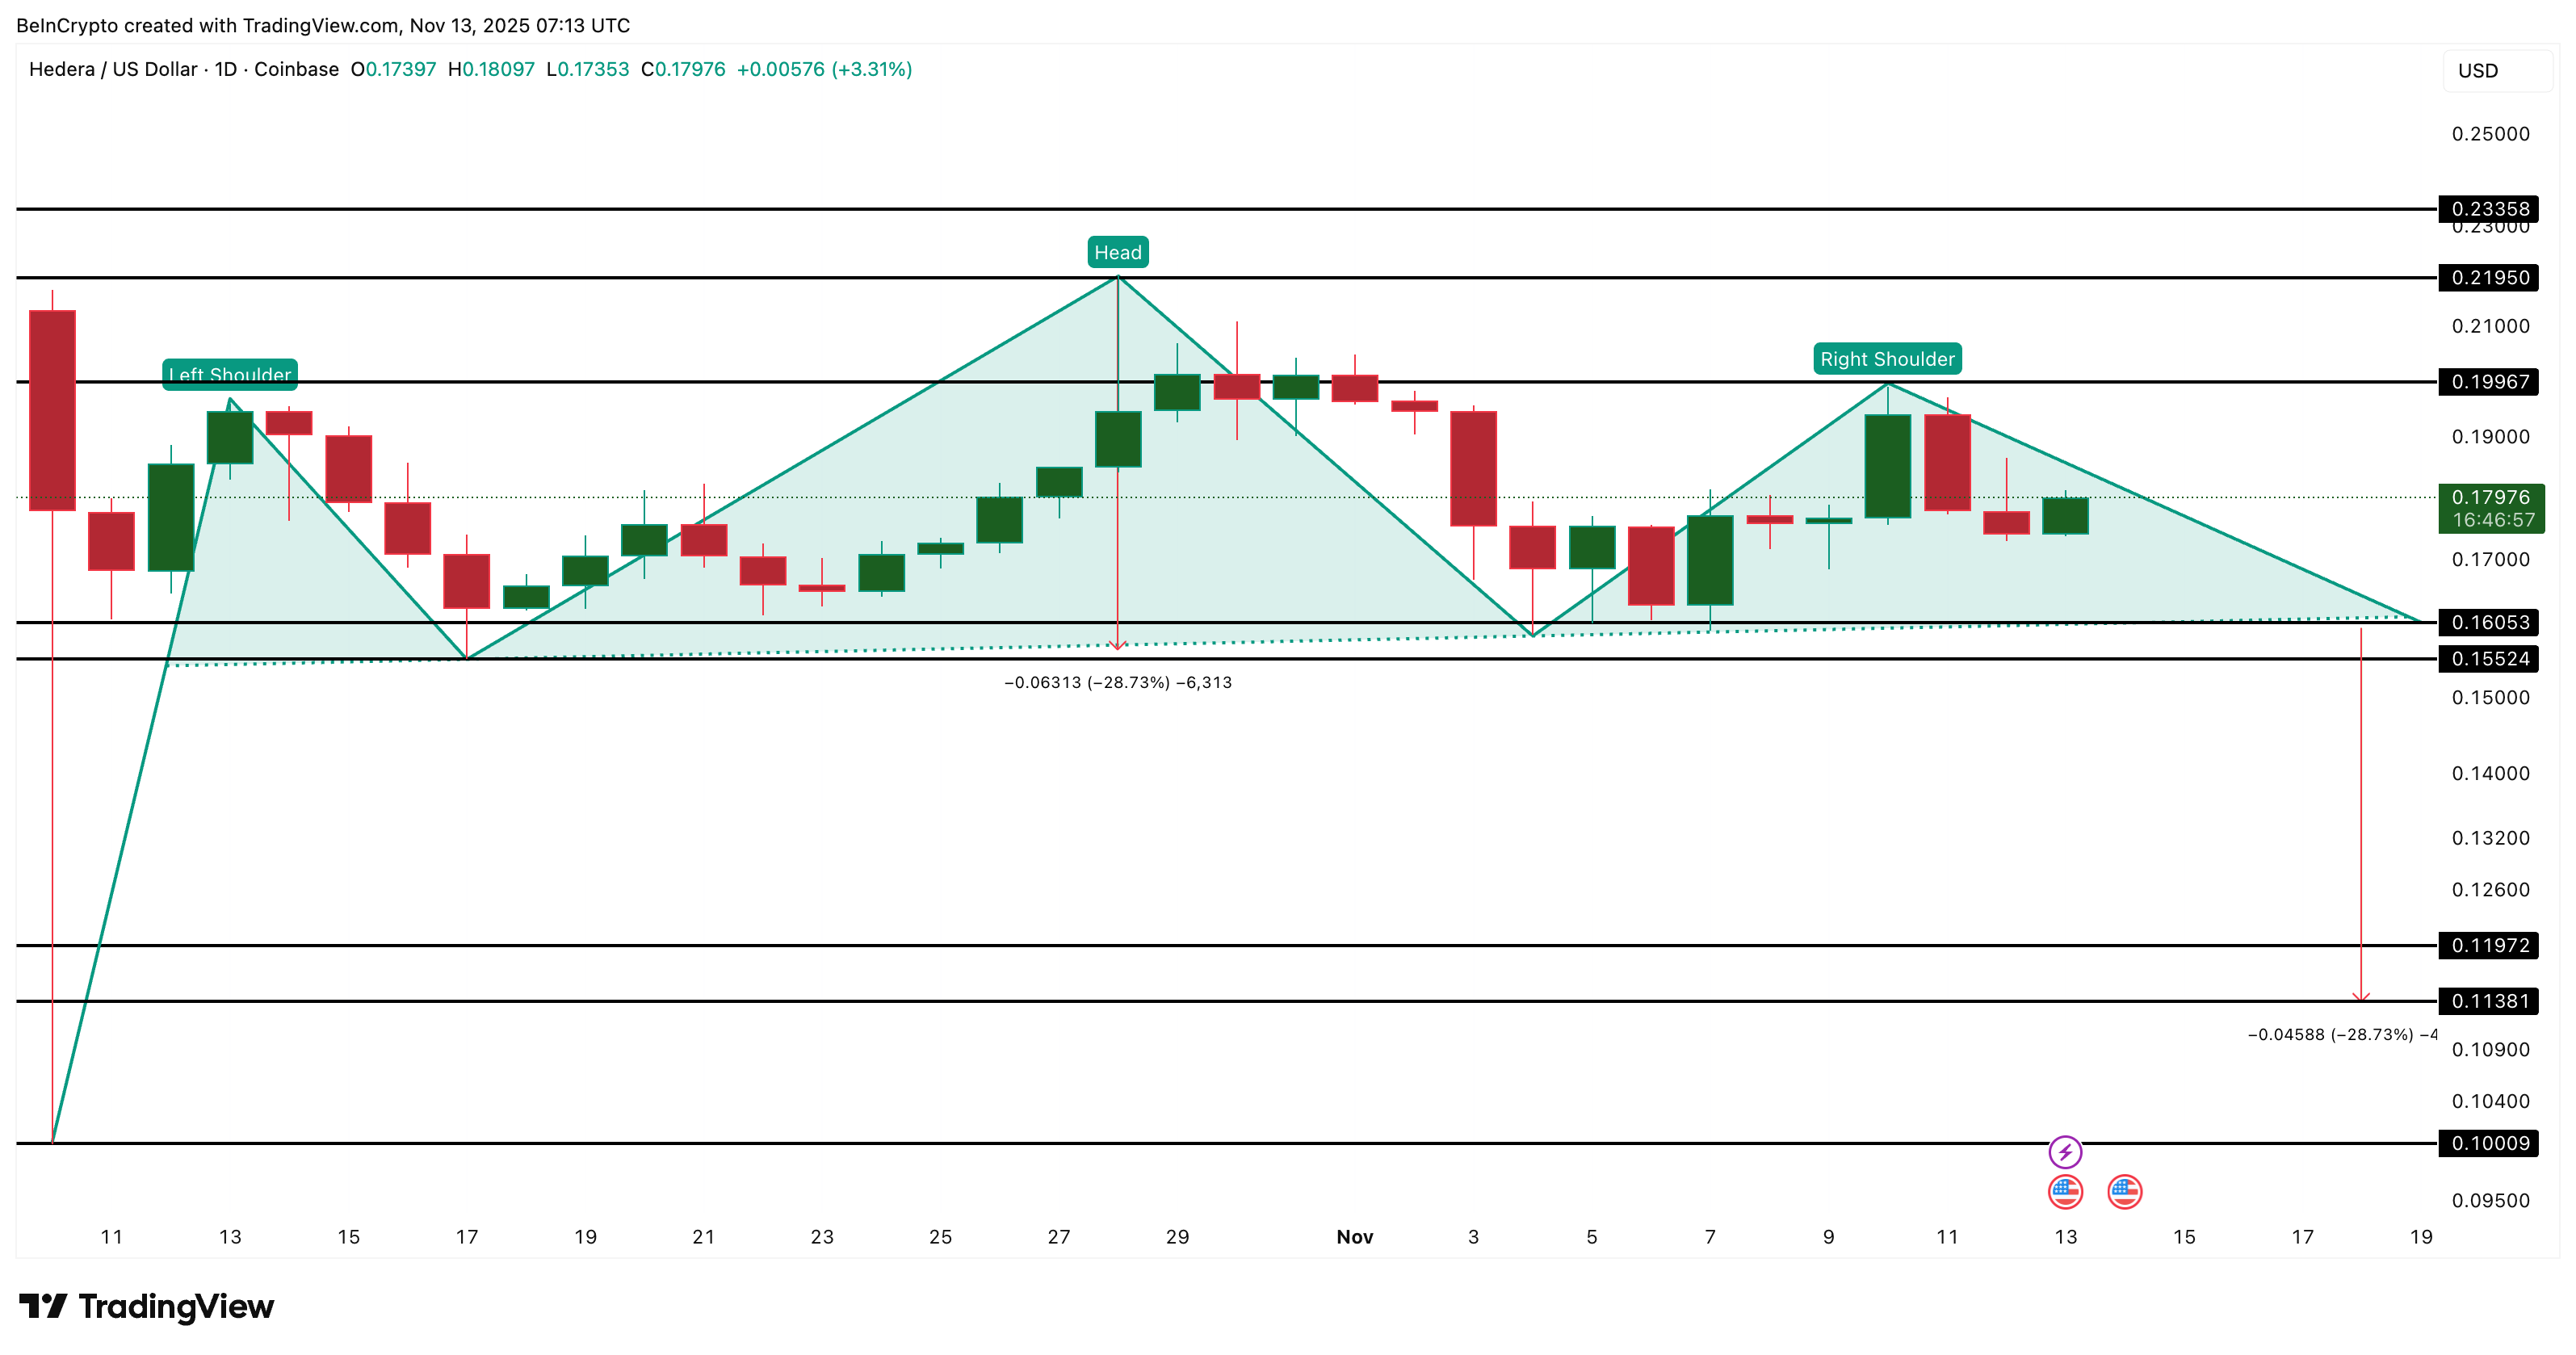 HBAR Price Analysis: TradingView
For any bullish scenario to hold, OBV must stay above its ascending trendline. If OBV fails, the neckline breaks faster — and the long squeeze risk increases sharply. For now, the HBAR price is heading toward a crash site, with one level ($0.160) still standing between the price and the fall.
The post HBAR Heads Toward a Crash Site — One Level Stands Between Price and the Fall appeared first on BeInCrypto.


 24h Most Popular


 Utilities