
HBAR ($0.16) is down almost 11% in the past week, and yesterday it finally broke below its neckline, completing the head and shoulders pattern we projected on November 13. Despite the breakdown, the last 24 hours have been surprisingly flat.
And while the structure still points toward lower levels, early signs suggest that traders betting on deeper downside may be walking into a bear trap instead. Here is why.
Selling Rises and Shorts Pile Up — But The Setup Isn’t That Simple
HBAR’s spot flows show a sharp shift in behaviour after the breakdown. On November 14, HBAR recorded –4.03 million in net outflows, meaning more tokens were leaving exchanges as buyers accumulated.
Today, after the pattern breakdown confirmed, flows flipped to +420,790 HBAR.
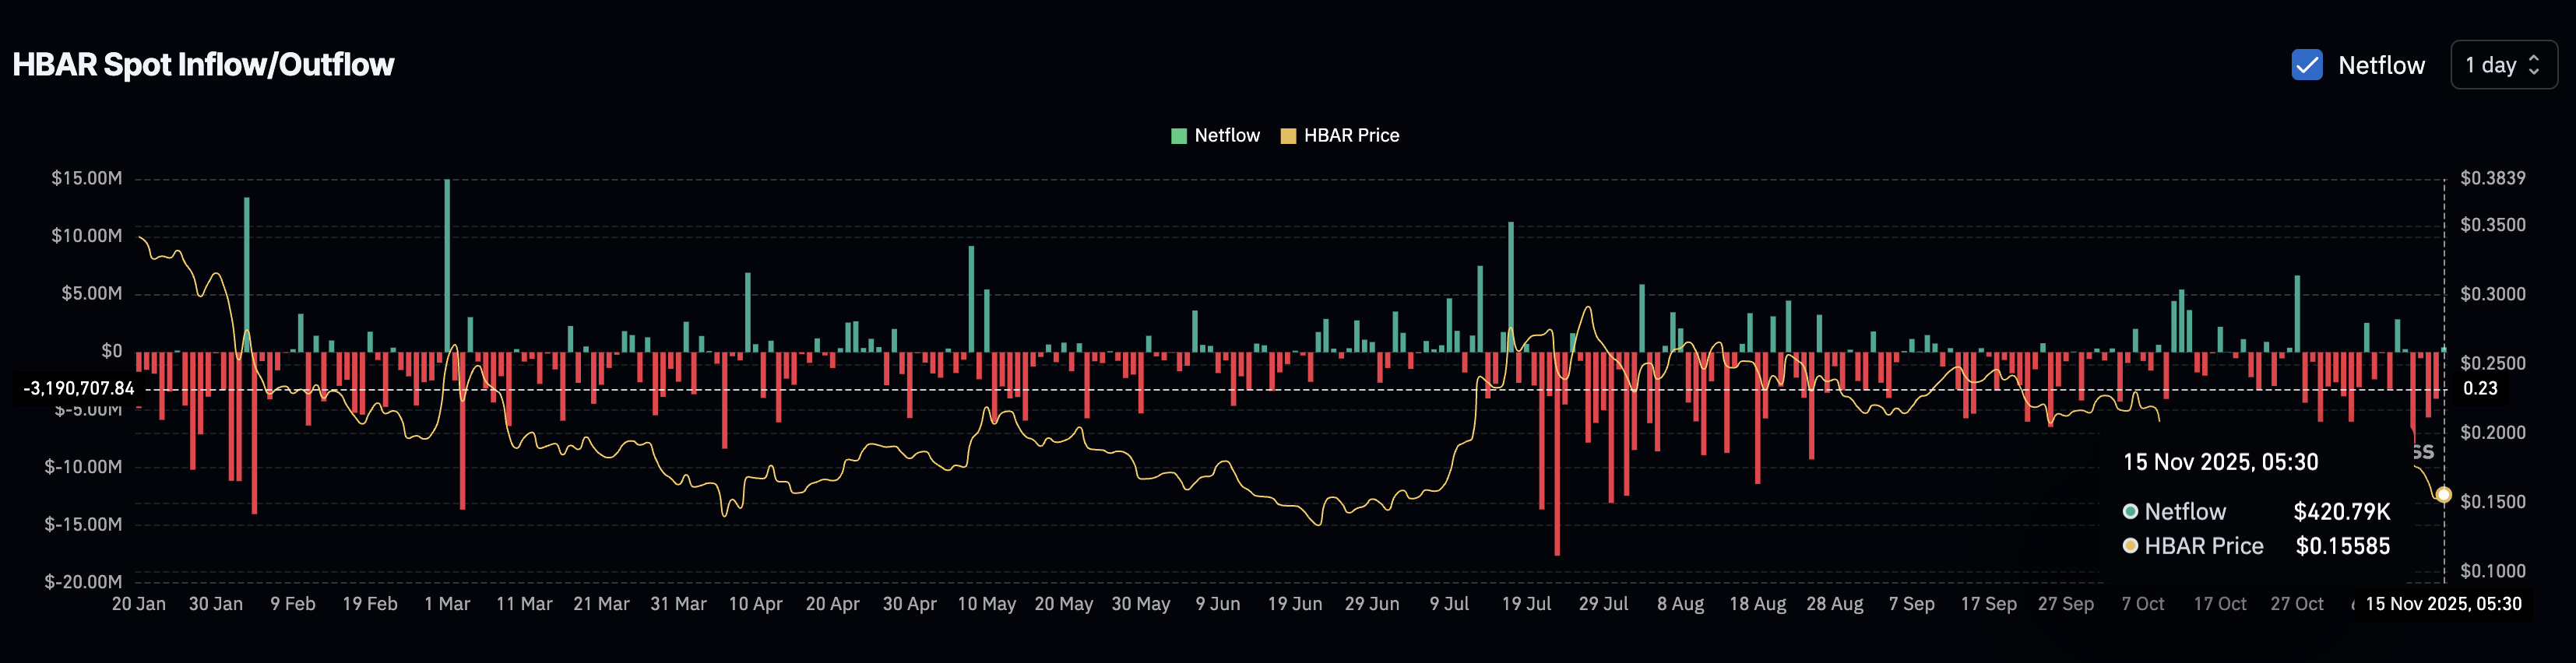 Sellers Are Back Post Breakdown: Coinglass
Want more token insights like this? Sign up for Editor Harsh Notariya’s Daily Crypto Newsletter here.
That is a 110% swing from negative to positive netflow — a clear sign that sellers have stepped in aggressively after the pattern break.
The derivatives market shows an even stronger tilt. On Bitget’s liquidation map alone, short exposure is $16.71 million, while long exposure is $6.09 million. This means shorts now control 73% of all leveraged positions — about 2.7 times more than longs.
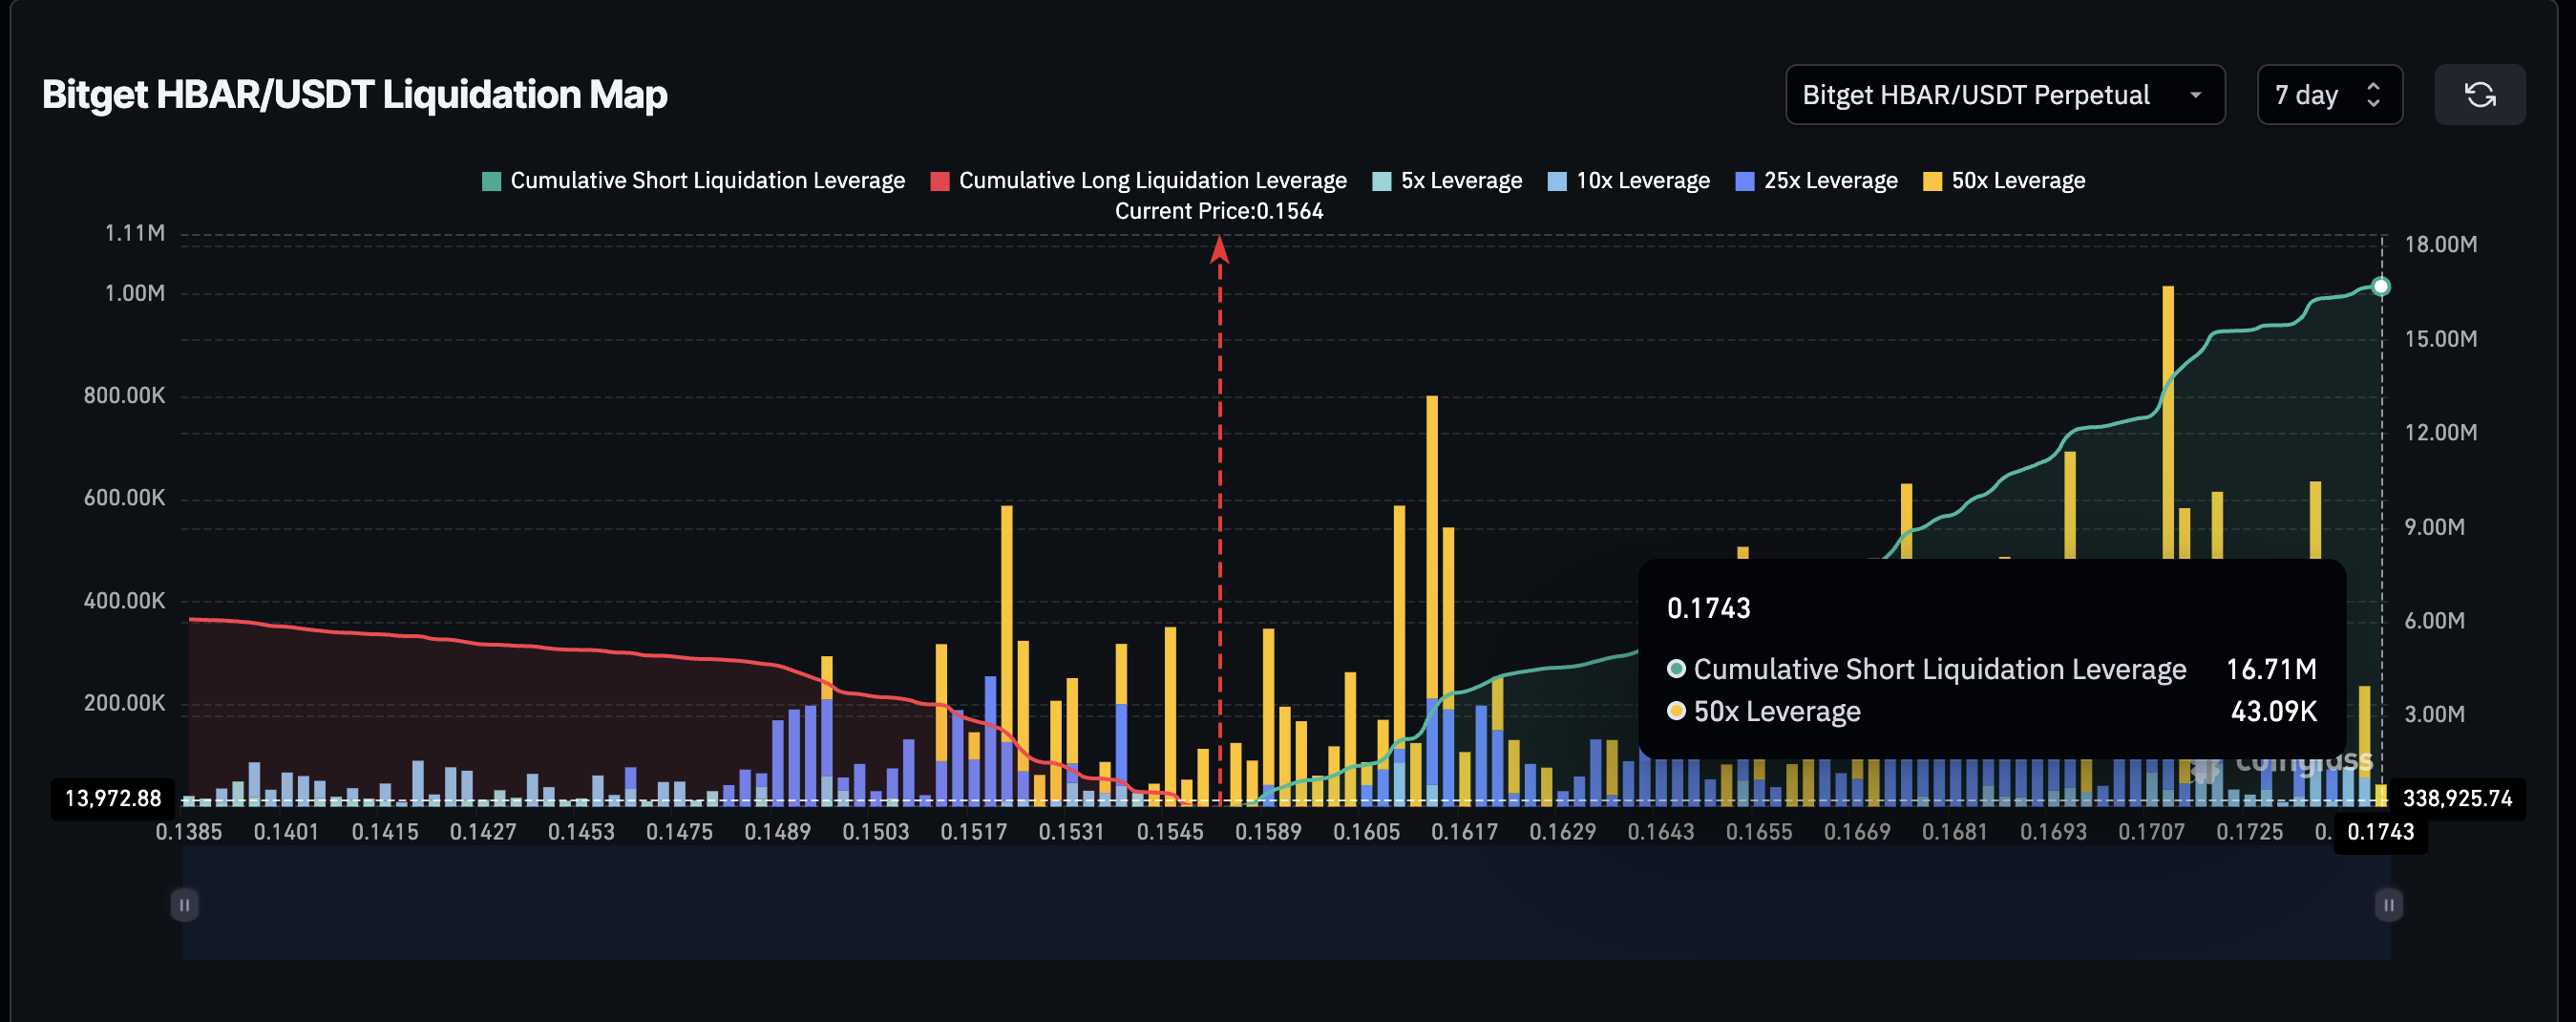 HBAR Shorts Dominate The Map: Coinglass
This kind of crowded positioning often fuels the conditions for a bear trap risk, where price briefly reverses upward and forces shorts to close their positions at a loss.
The HBAR price breakdown has occurred, yes — but this positioning makes it dangerous to assume the move will continue uninterrupted.
One Move Could Drive HBAR Price Rebound, Hitting Short Liquidations
The price chart contains the key reason a bear trap is possible. While HBAR broke below the neckline, the follow-through has been weak. At the same time, the Relative Strength Index (RSI) — a metric that measures price momentum to show if an asset is oversold or overbought — is showing a notable pattern.
Between October 17 and November 14, the price made a lower low, while RSI formed a higher low. This is a bullish RSI divergence, and it often appears just before a short-term reversal attempt.
If the divergence plays out, the first trigger is a move back above $0.160, which is exactly where the neckline sits. Reclaiming this level puts a large block of short positions at risk.
The liquidation map shows that shorts begin getting squeezed as the price rises above this zone.
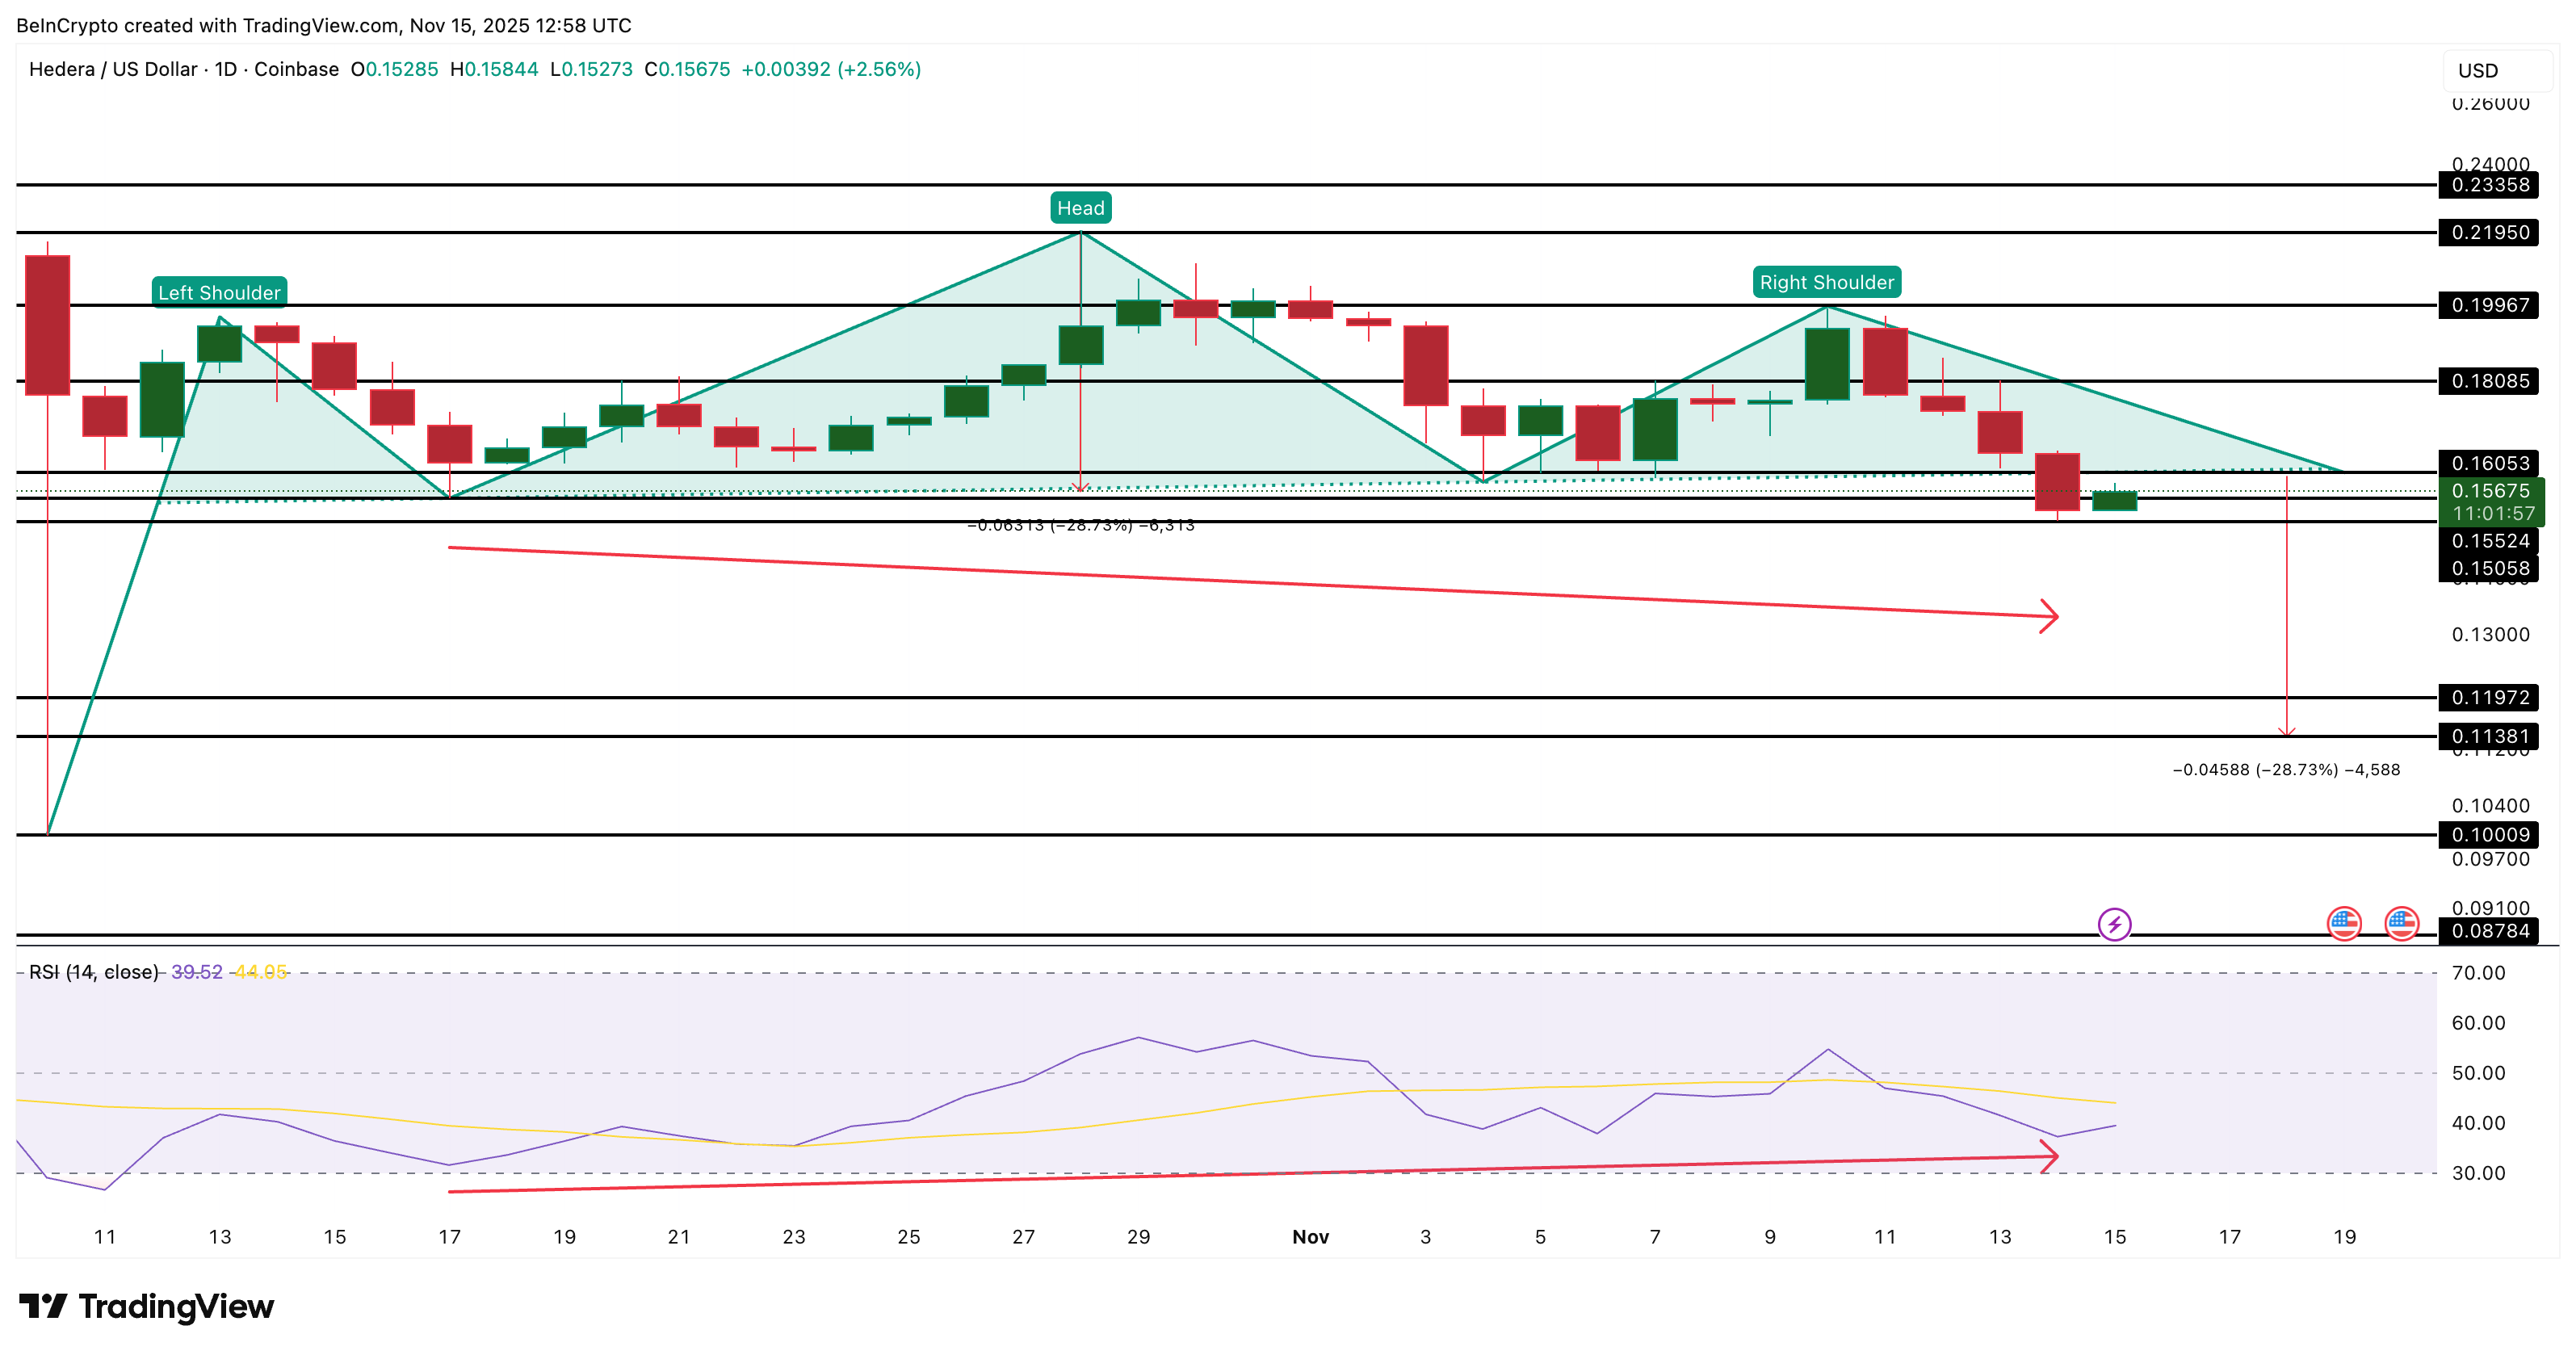 HBAR Price Analysis: TradingView
A push above $0.180 would confirm the trap is fully in place and force even deeper short liquidations, giving HBAR room for a stronger rebound. However, the trap only works if buyers hold key support levels.
If HBAR drops below $0.155, the divergence weakens and the downtrend regains control. In that case, the head and shoulders projection remains valid, opening the way toward the earlier bearish target near $0.113.
The post HBAR Price Breakdown Was Expected — The Bear Trap Risk Was Not appeared first on BeInCrypto.


 24h Most Popular


 Utilities