
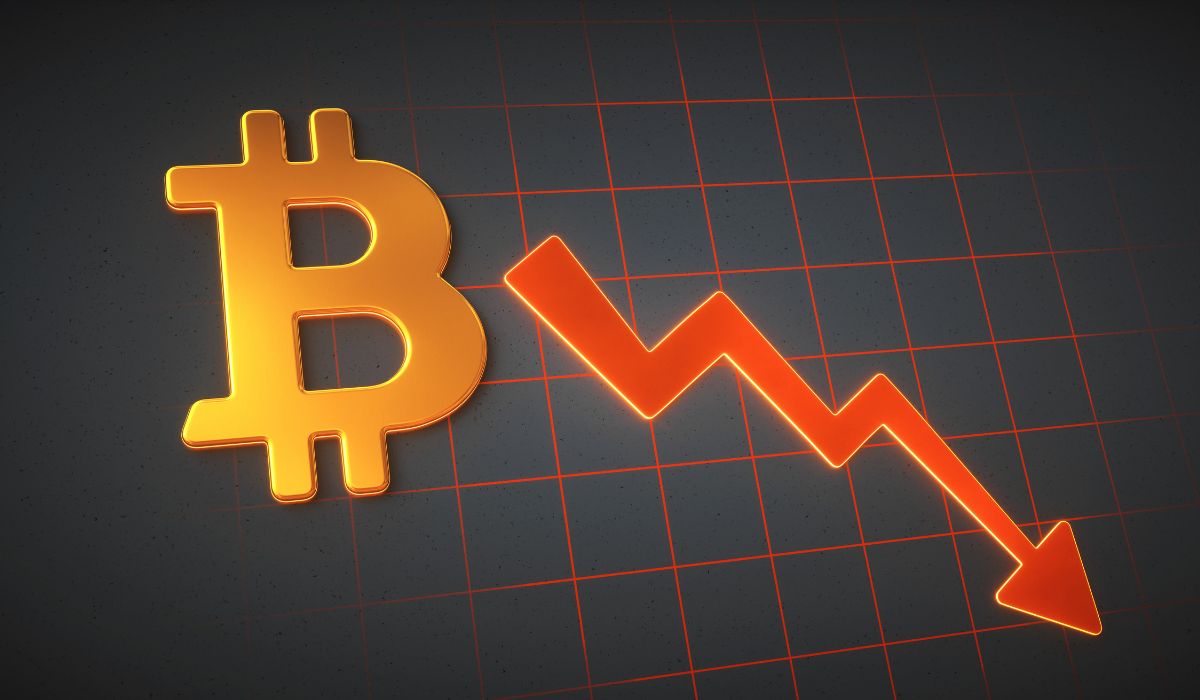
HBAR ($0.11) price is under fresh pressure. The token is down about 17% over the past seven days and nearly 24% month over month, extending a steady downtrend.
The latest drop matters because a key technical target has now been met. What comes next depends on whether this level holds or gives way.
Price Hits Its Head-and-Shoulders Target
On November 13, HBAR confirmed a head-and-shoulders breakdown on the daily chart. The pattern projected a downside move of roughly 28% from the neckline.
That target was reached on December 15, when the price tagged the $0.113 area. Since then, HBAR has stalled and moved sideways. This matters because the exact breakdown target is now acting as short-term support.
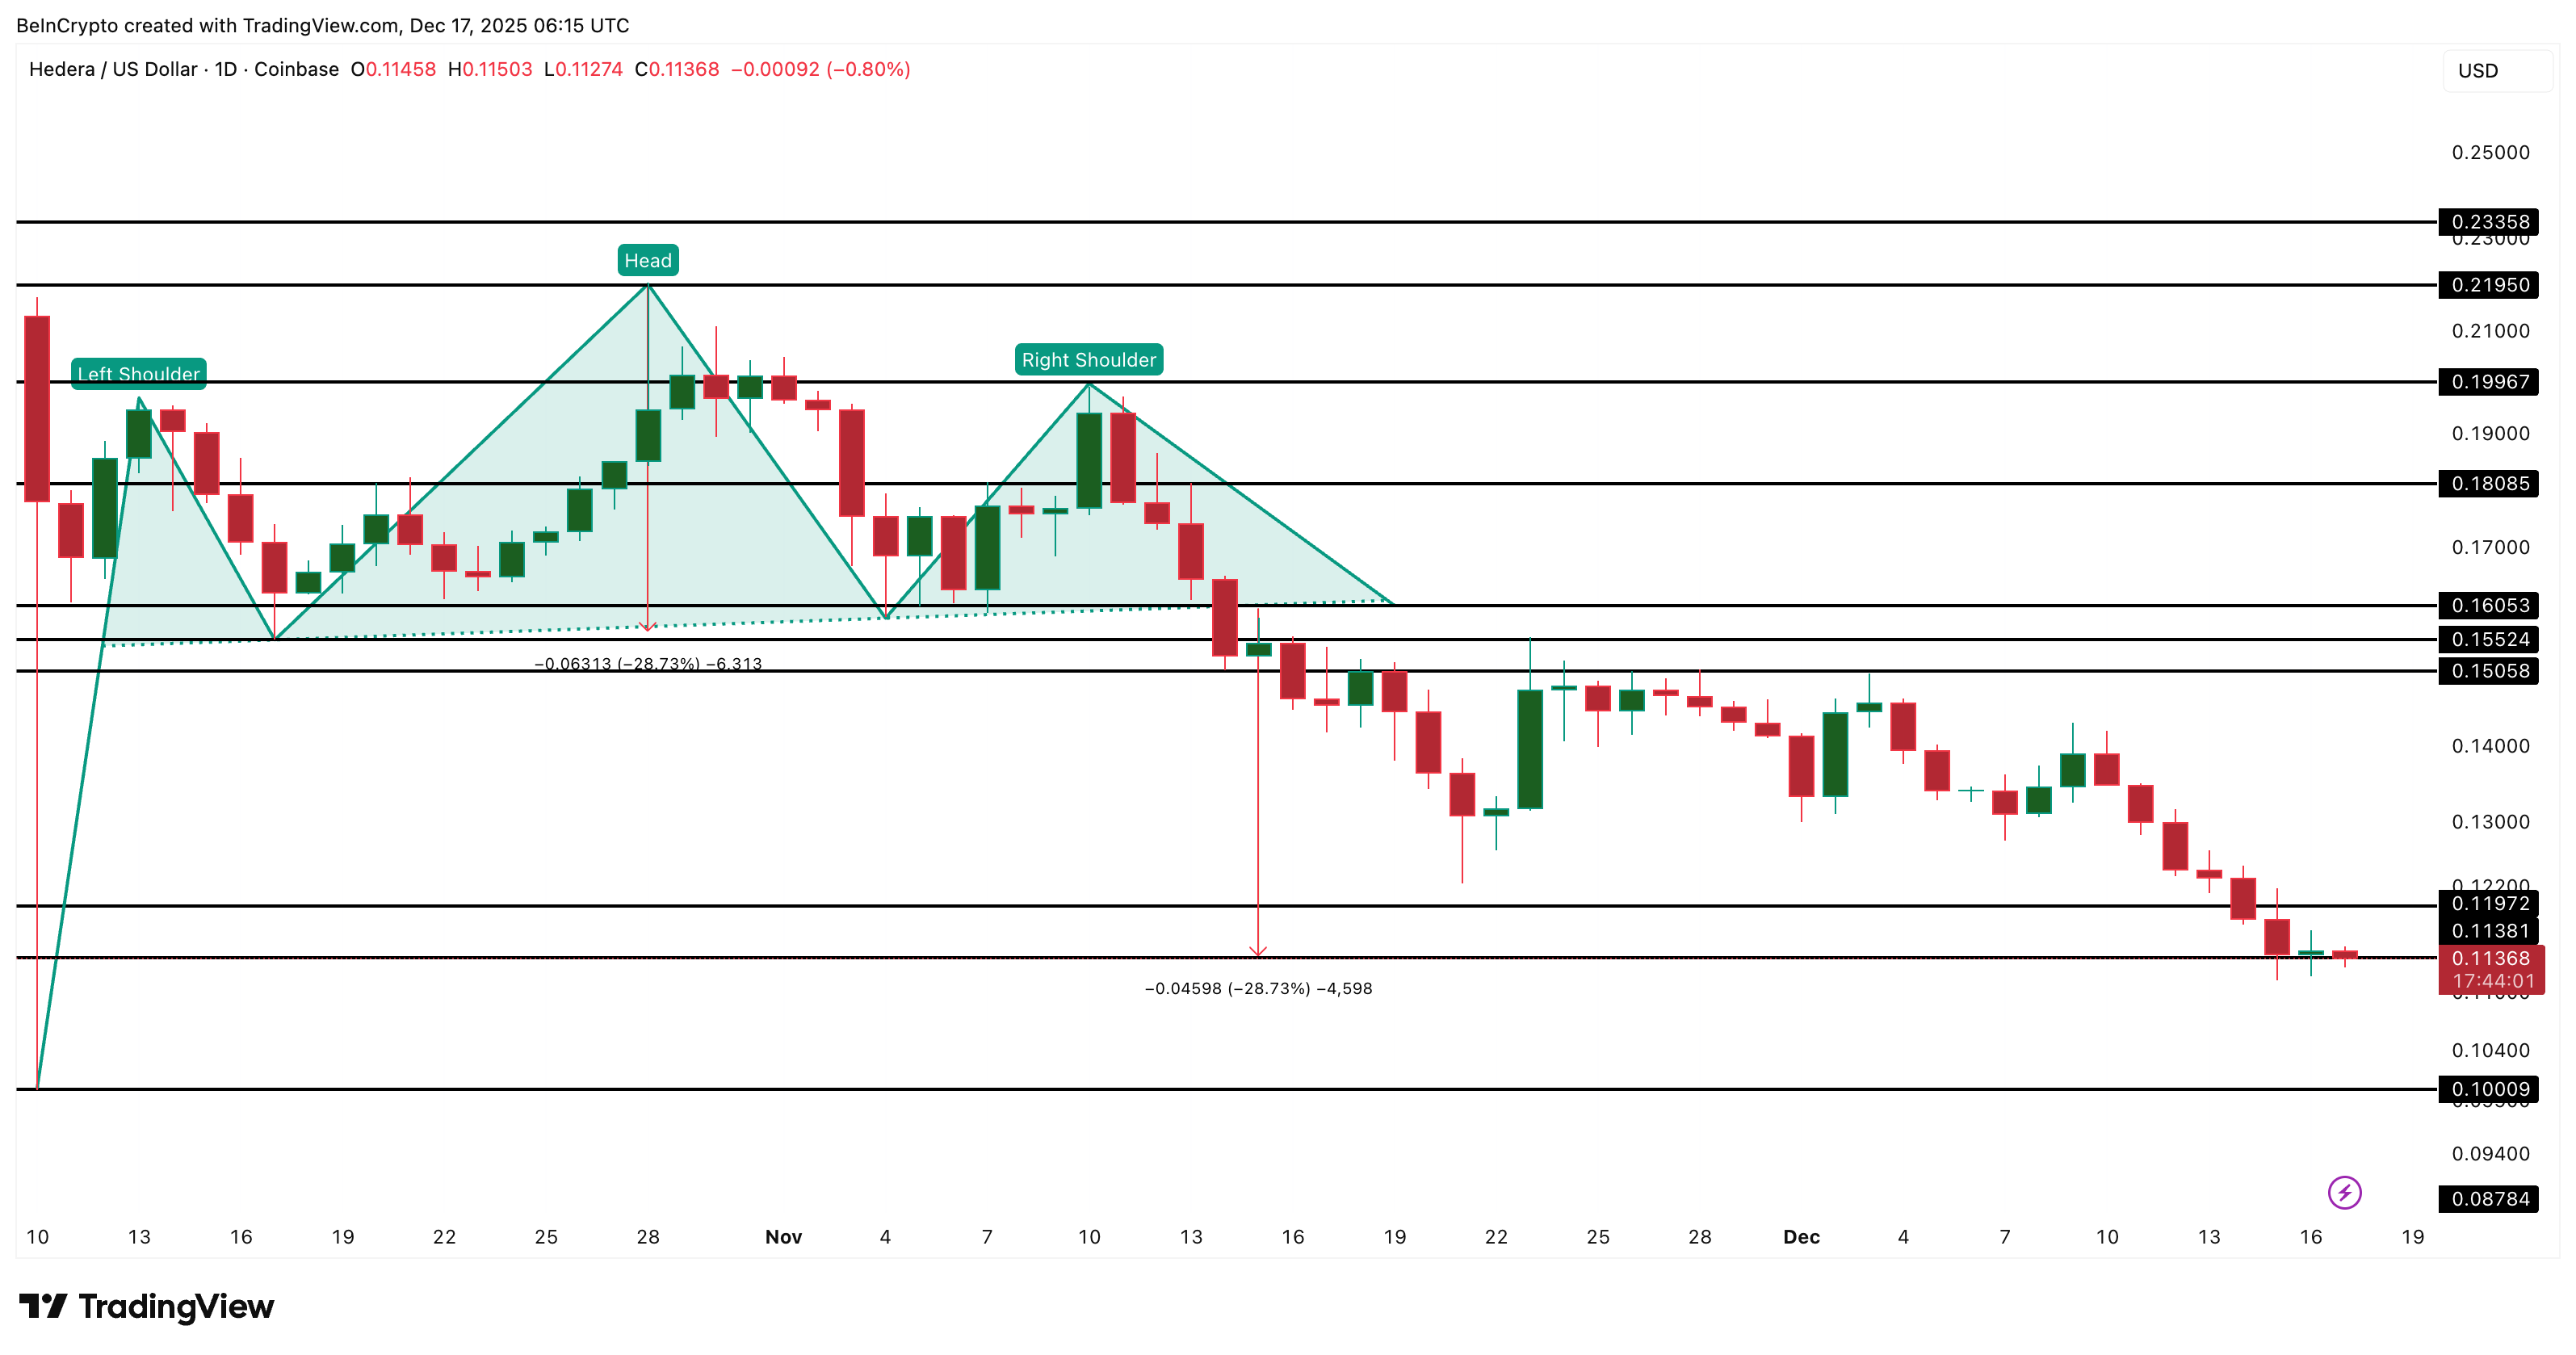 Price Target Reached: TradingView
Want more token insights like this? Sign up for Editor Harsh Notariya’s Daily Crypto Newsletter here.
Technically, this is the first moment where sellers pause to reassess. A clean break below this level would confirm trend continuation. Holding it, at least temporarily, opens the door to a short bounce. The chart has done its job. Now the indicators decide whether the move is finished.
On-Chain and Flow Data Still Point to Weak Demand
The problem is that capital flow metrics do not support a durable rebound yet.
The Chaikin Money Flow (CMF) has dropped to around -0.32, its lowest reading in roughly a year. CMF tracks whether large money is entering or leaving. Deeply negative readings mean capital is exiting Hedera (HBAR), even if the price is trading against the support line.
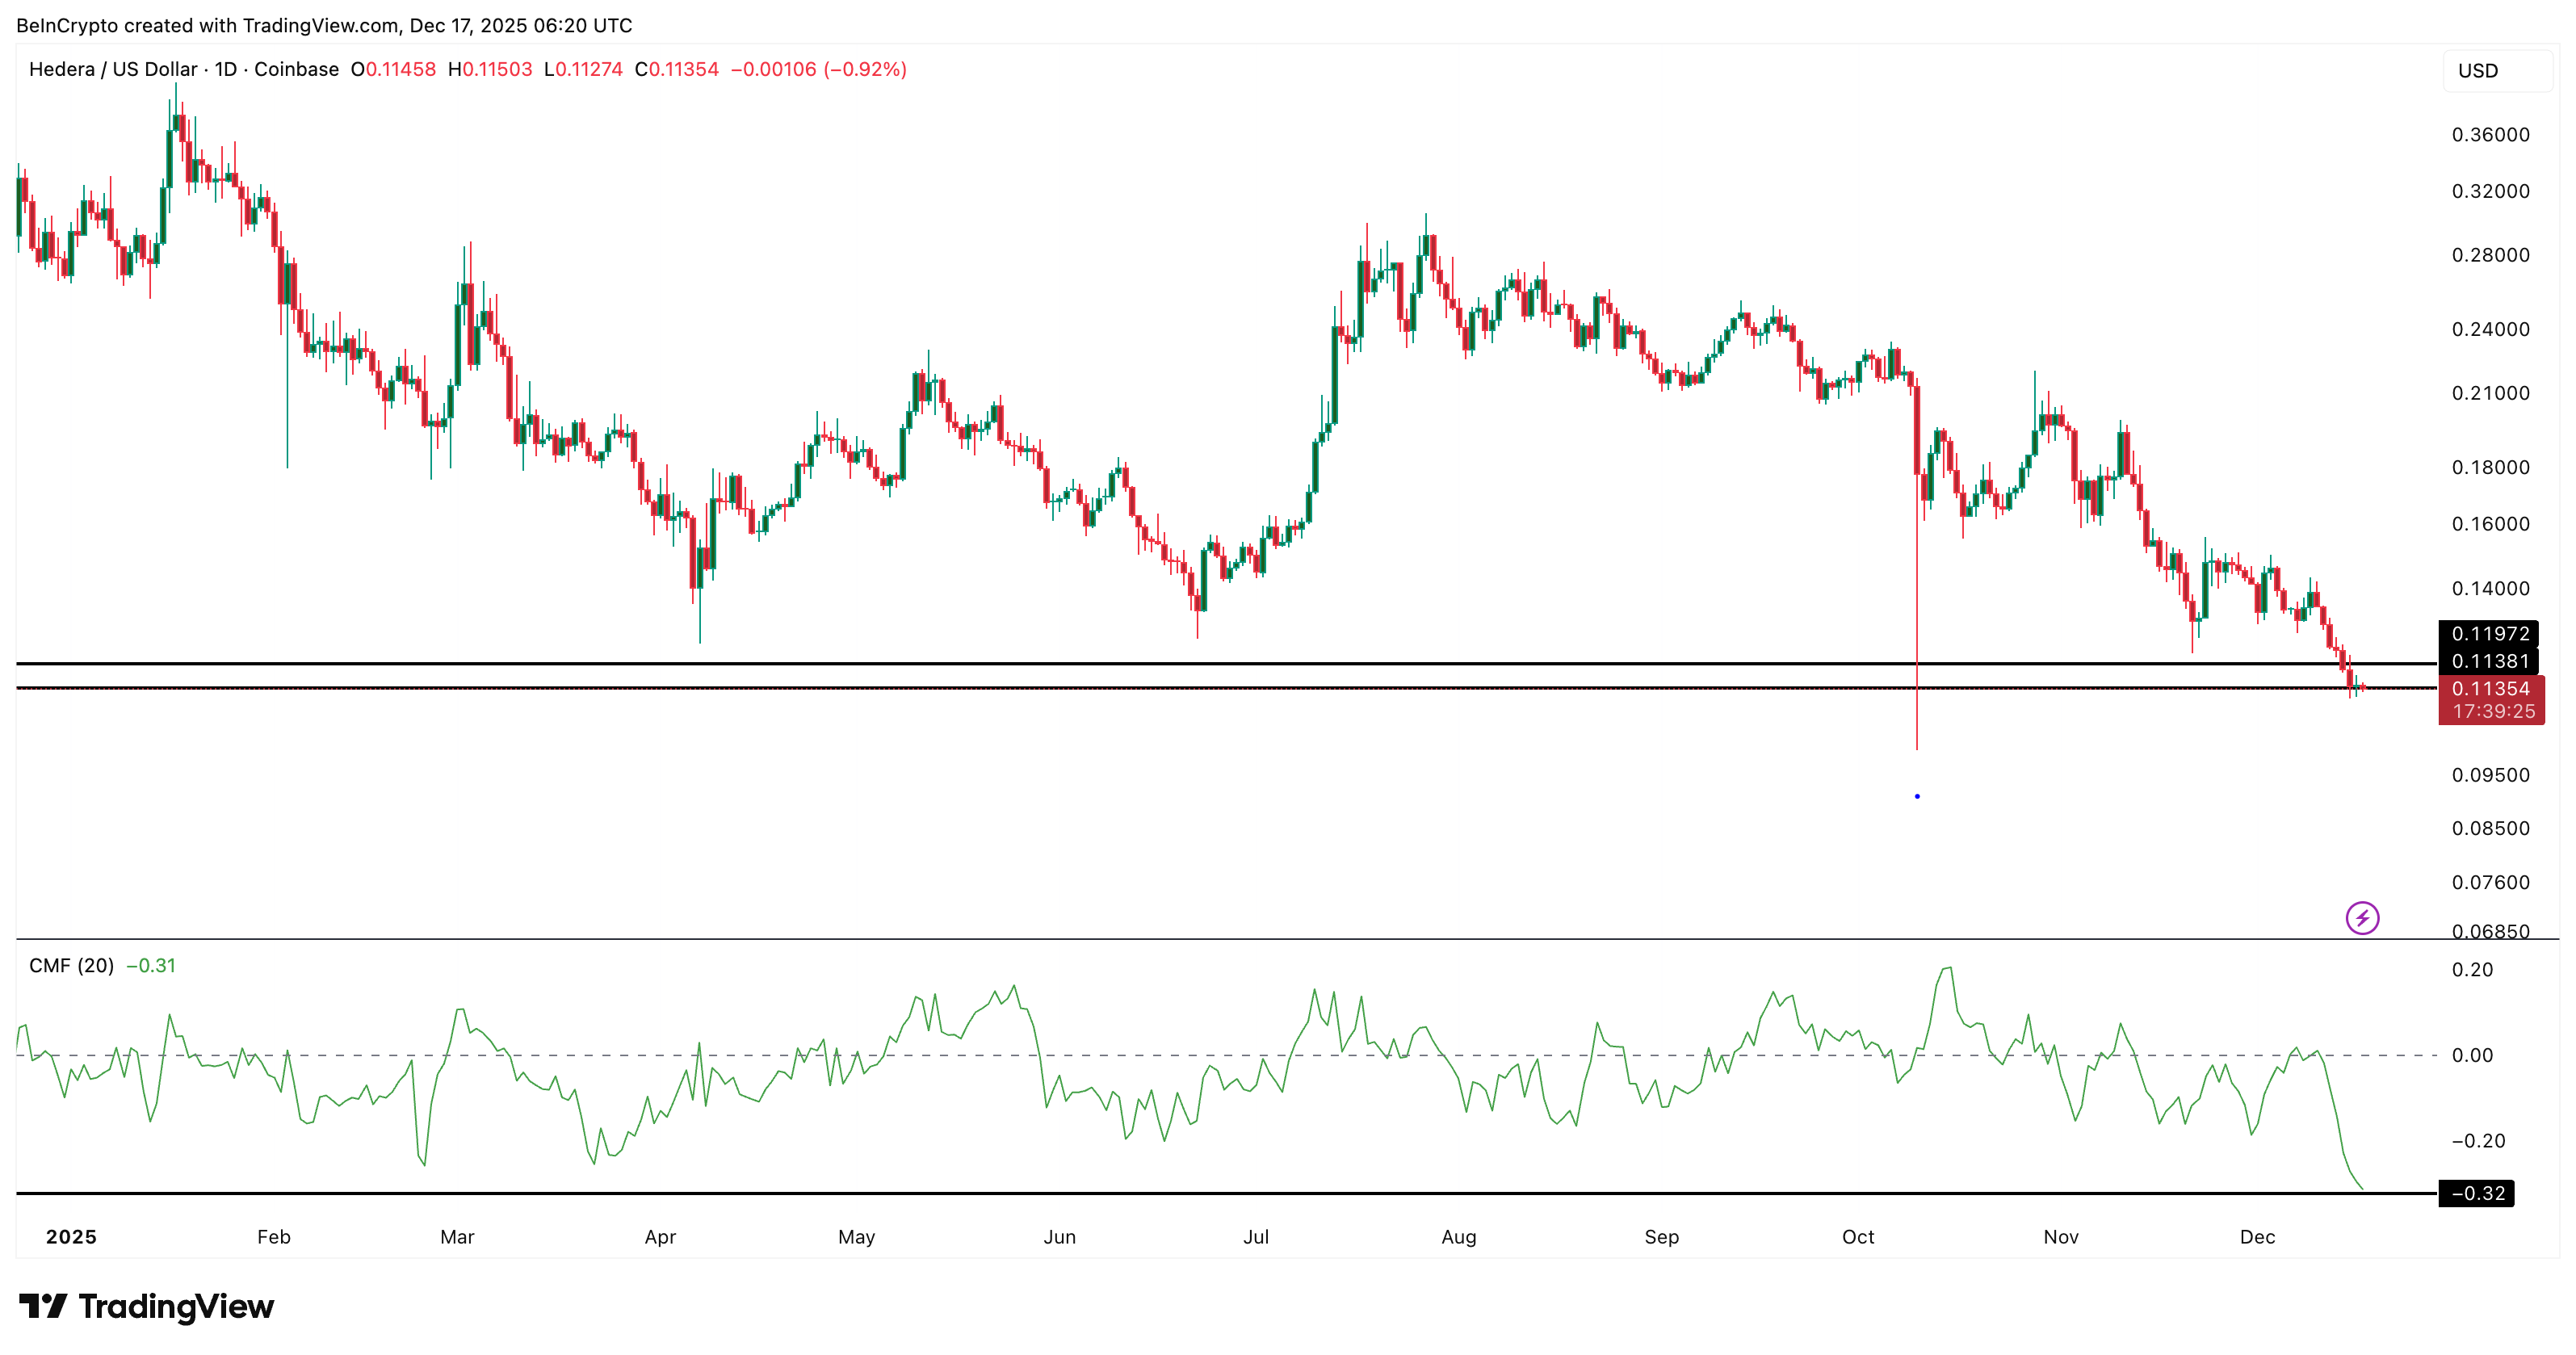 CMF Drops To Yearly Low: TradingView
This tells us the recent pause is not being driven by strong buyers. Big money, possibly whales, is still stepping away.
Spot flow data adds another layer of weakness. On December 14, HBAR recorded net exchange outflows of about $3.16 million, meaning tokens were moving off exchanges. That usually points to short-term buying or reduced sell intent.
However, that support did not last. Over the past 48–72 hours, flows have flipped back into net inflows, even if the number is small, around $0.30 million. The direction matters more than the size. It shows that the earlier buying pressure has faded, and coins are starting to move back toward exchanges.
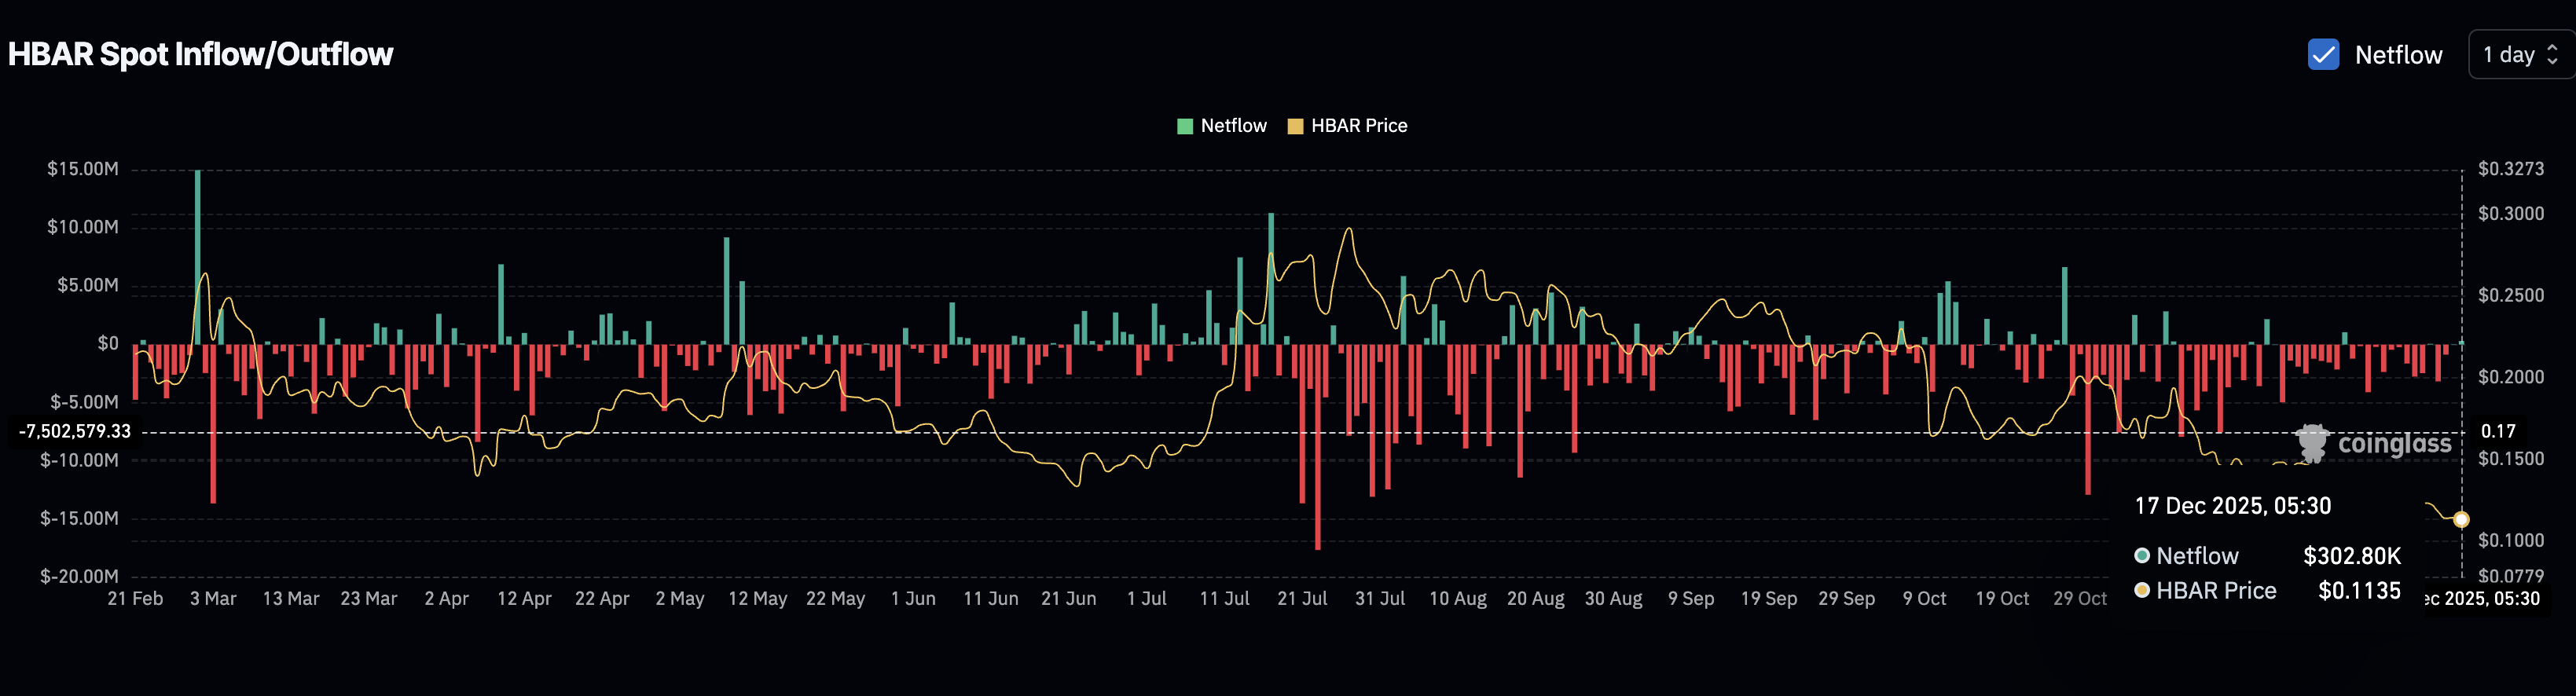 HBAR Sellers Are Back: Coinglass
In simple terms, buying interest cooled quickly. Large holders are still absent, and short-term buyers have stepped back.
HBAR Price Levels That Decide Bounce or Breakdown
With the breakdown target reached, the chart now opens up, more so with big money and retail indifference established earlier.
If the HBAR price loses $0.113, the next support sits near $0.107. A clean break there exposes $0.095, which would imply another 16% downside from current levels.
On the upside, any recovery remains corrective unless price reclaims $0.155 on a daily close. That level aligns with prior support and the underside of the former range. Without it, rebounds are likely to fade.
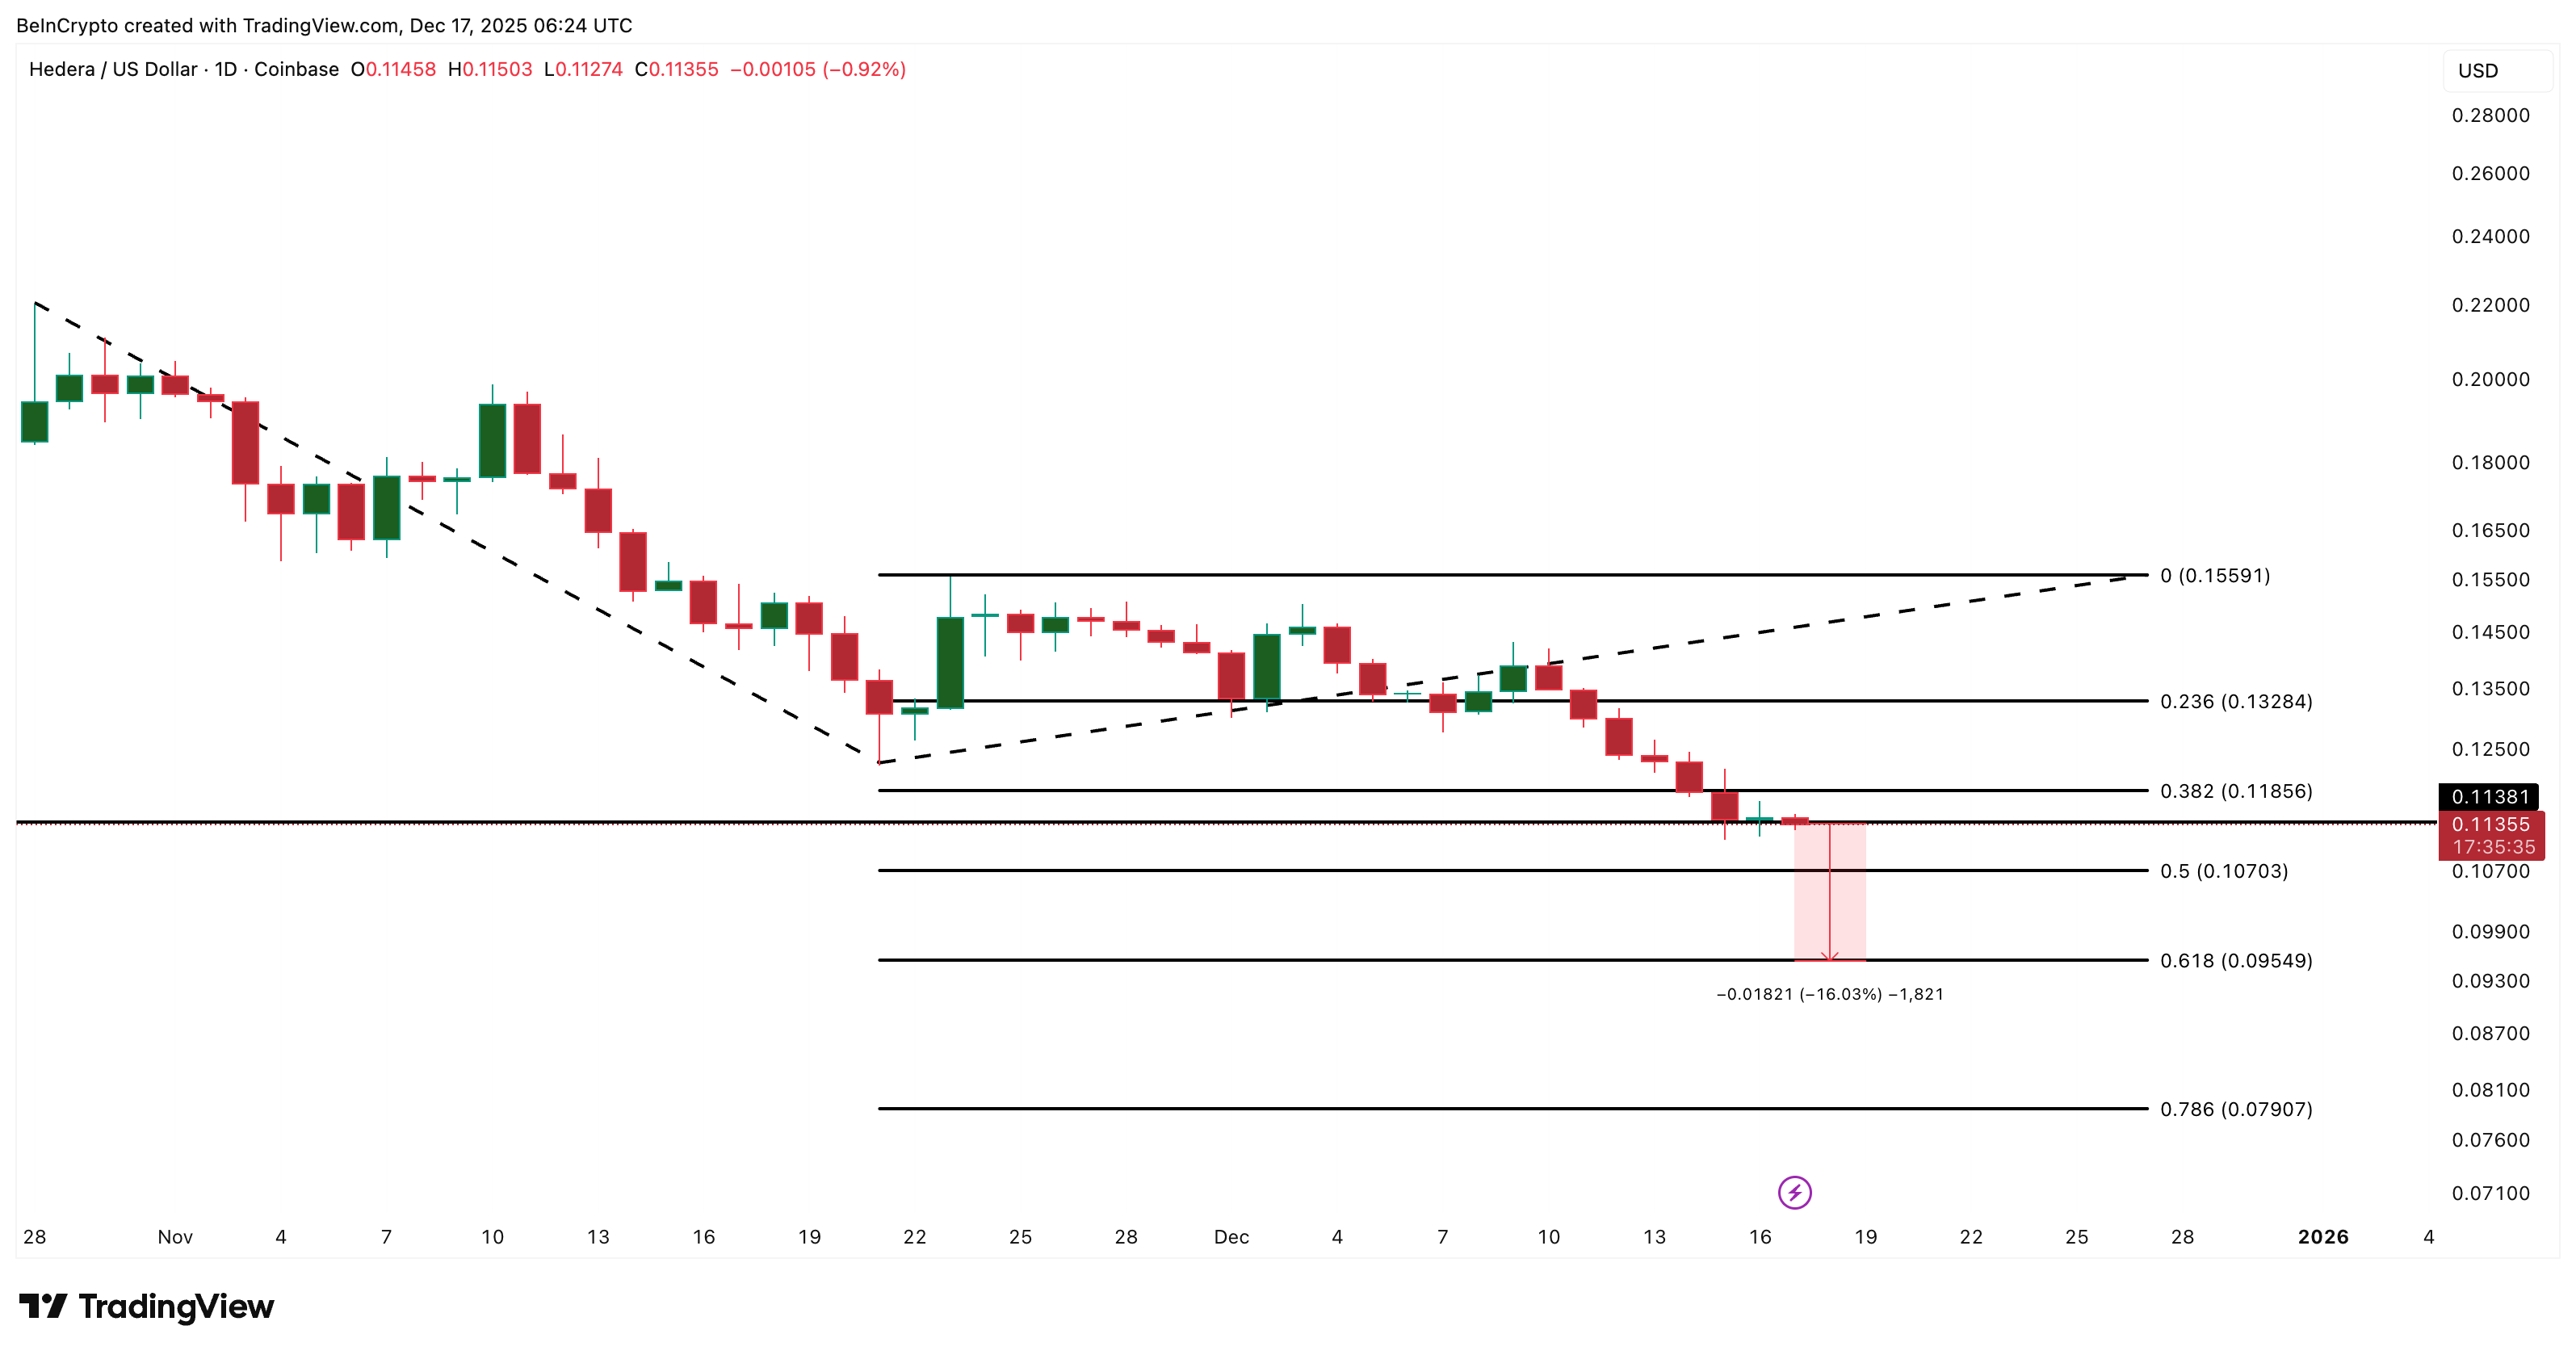 HBAR Price Analysis: TradingView
For now, HBAR has done what the breakdown predicted. The question is not whether the pattern worked. It did. The real question is whether weak demand turns this pause into the next leg lower. All signs point to a dip, at least for now.
The post HBAR Price Hits Breakdown Target — Bounce Now or Another 16% Drop? appeared first on BeInCrypto.


 24h Most Popular


 Utilities