.png)
After weeks of sluggish price action, XRP ($2.00) continues to bleed slowly across both its USDT ($1.01) and BTC ($90,536.00) pairs. There is no sign of bullish momentum or a meaningful shift in structure, and price remains trapped below key moving averages. Attempts at recovery have lacked follow-through, with each bounce getting rejected at lower levels. Until something breaks this trend, XRP remains technically weak.
Technical Analysis
By Shayan
The USDT Pair
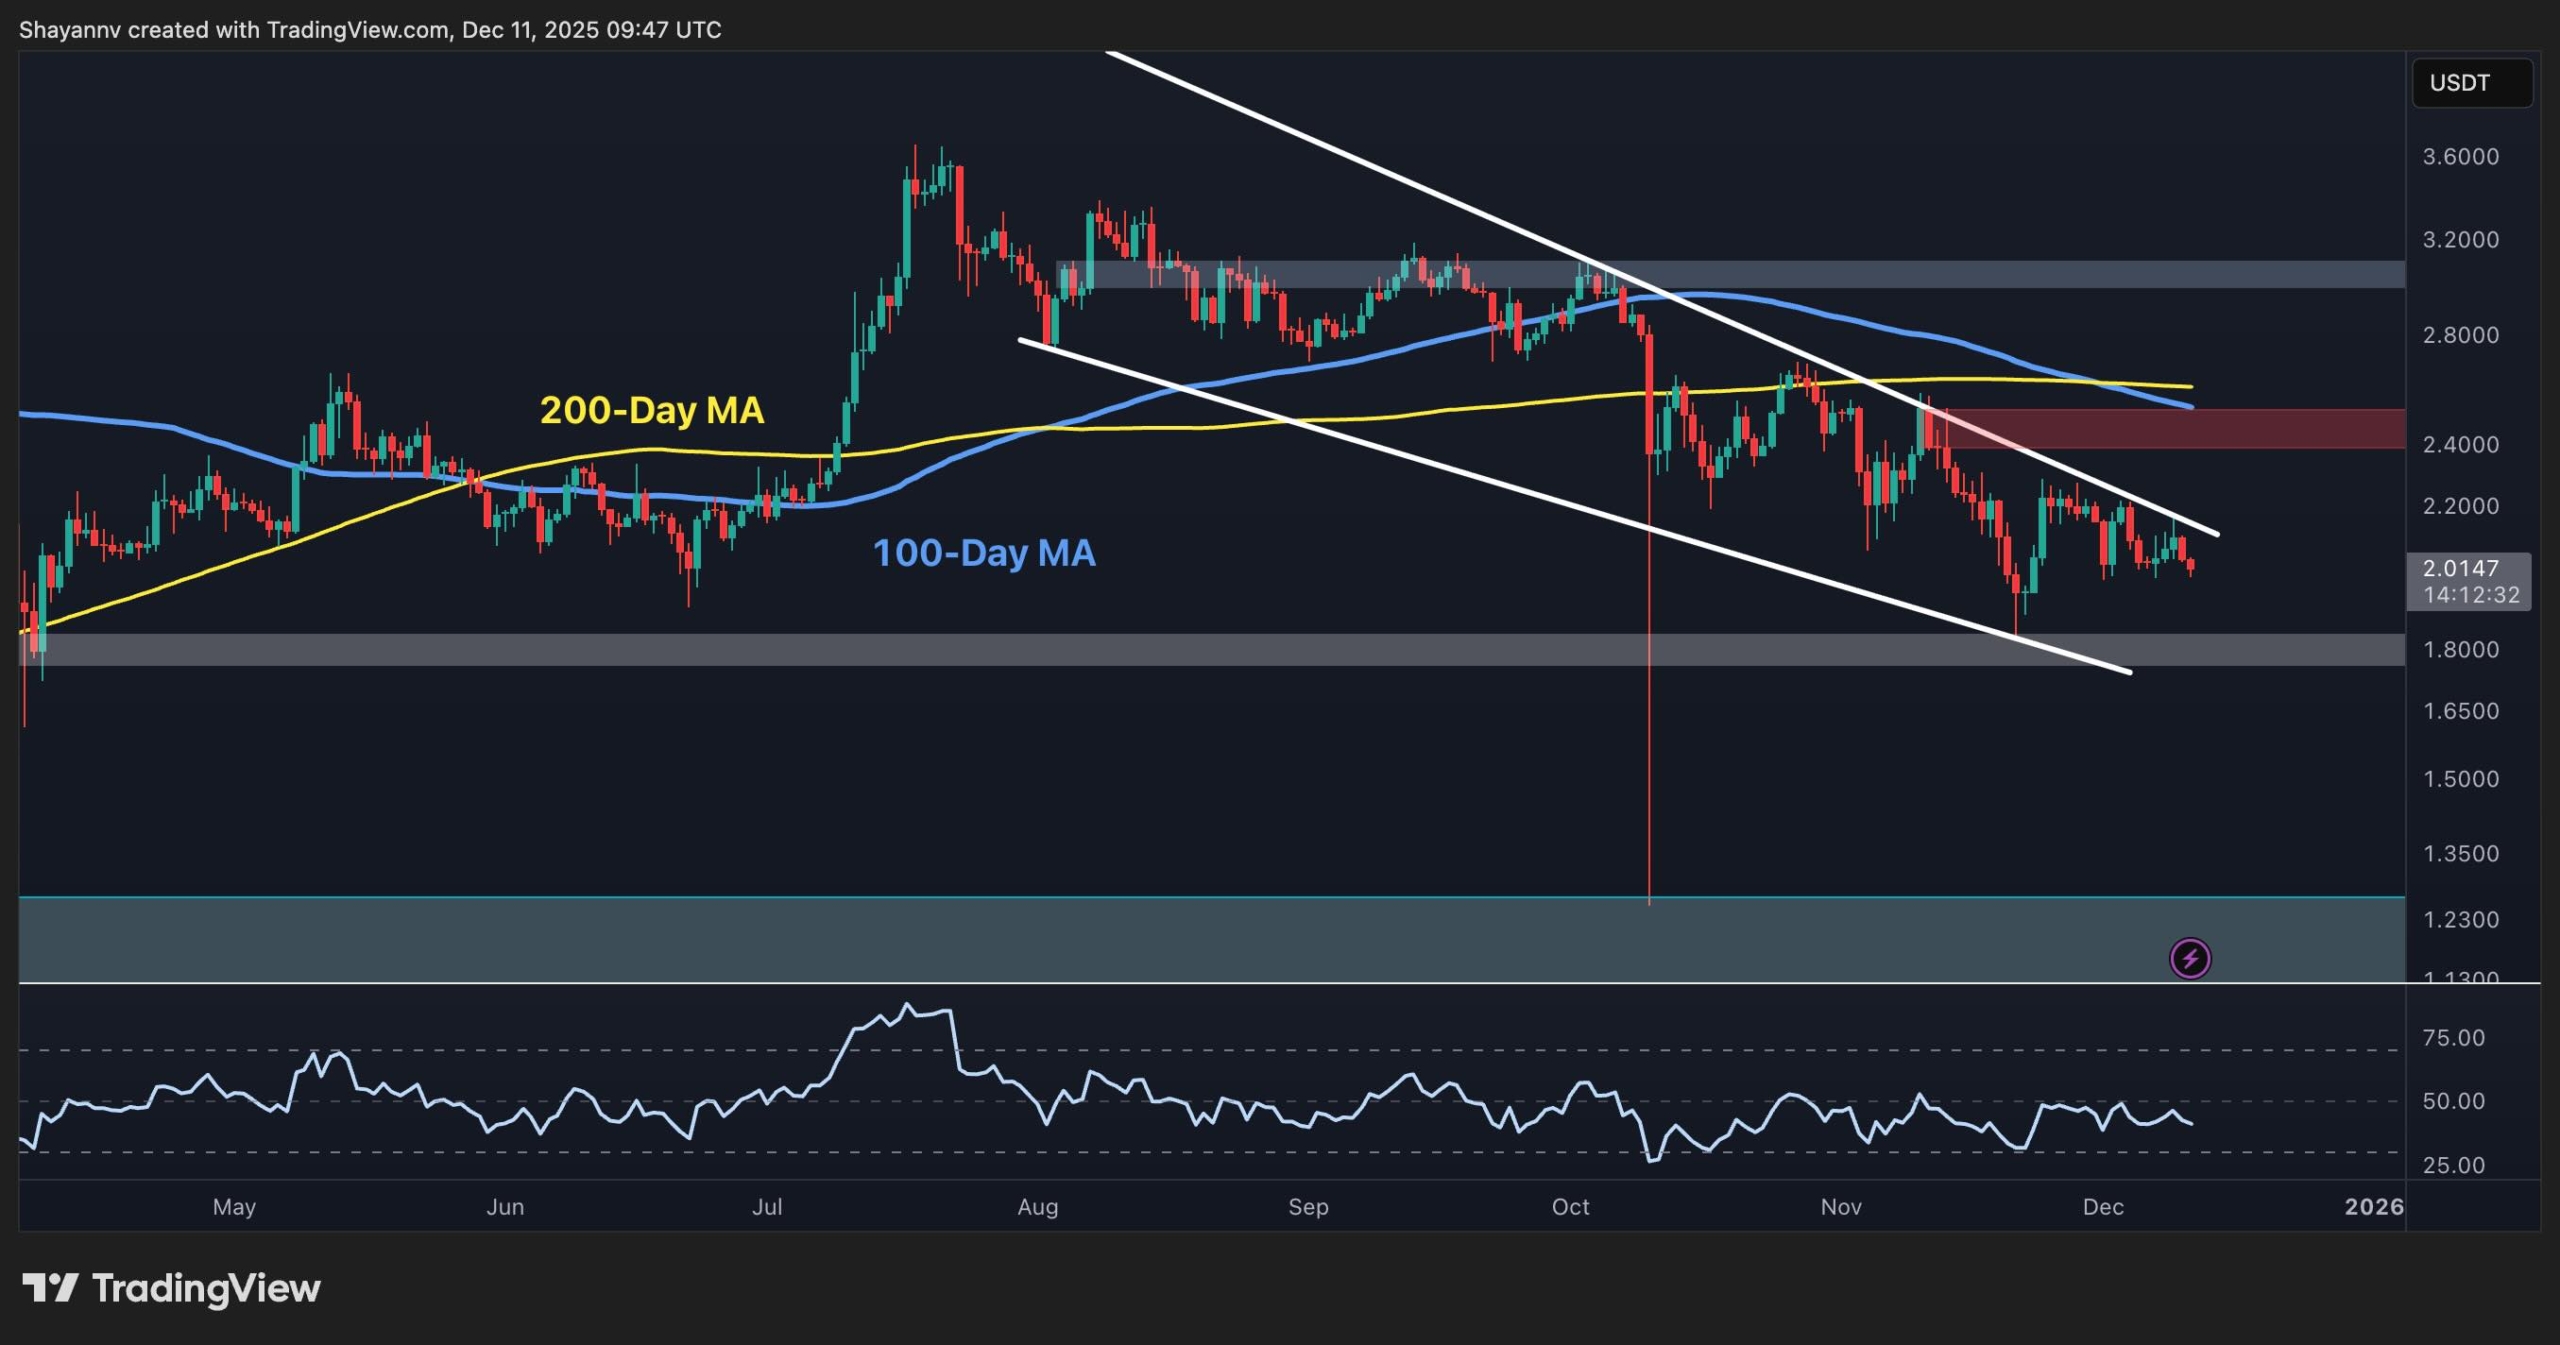
On the USDT daily chart, the price is still respecting the descending channel that has defined the downtrend since August. The 100-day and 200-day moving averages are now well above the current price at around $2.60, adding extra pressure from above. The recent rejection just below the $2.40 resistance and the failure to break the upper trendline confirm continued bearish control.
As of now, XRP is trading around $2.01, dangerously close to the $1.80 demand zone. A clean breakdown could open the door toward the next high-timeframe support at $1.50 and even the critical $1.20 zone. The RSI also hovers near 40 and shows no bullish divergence, meaning momentum continues to lean bearish.
 Source: TradingView
The BTC Pair
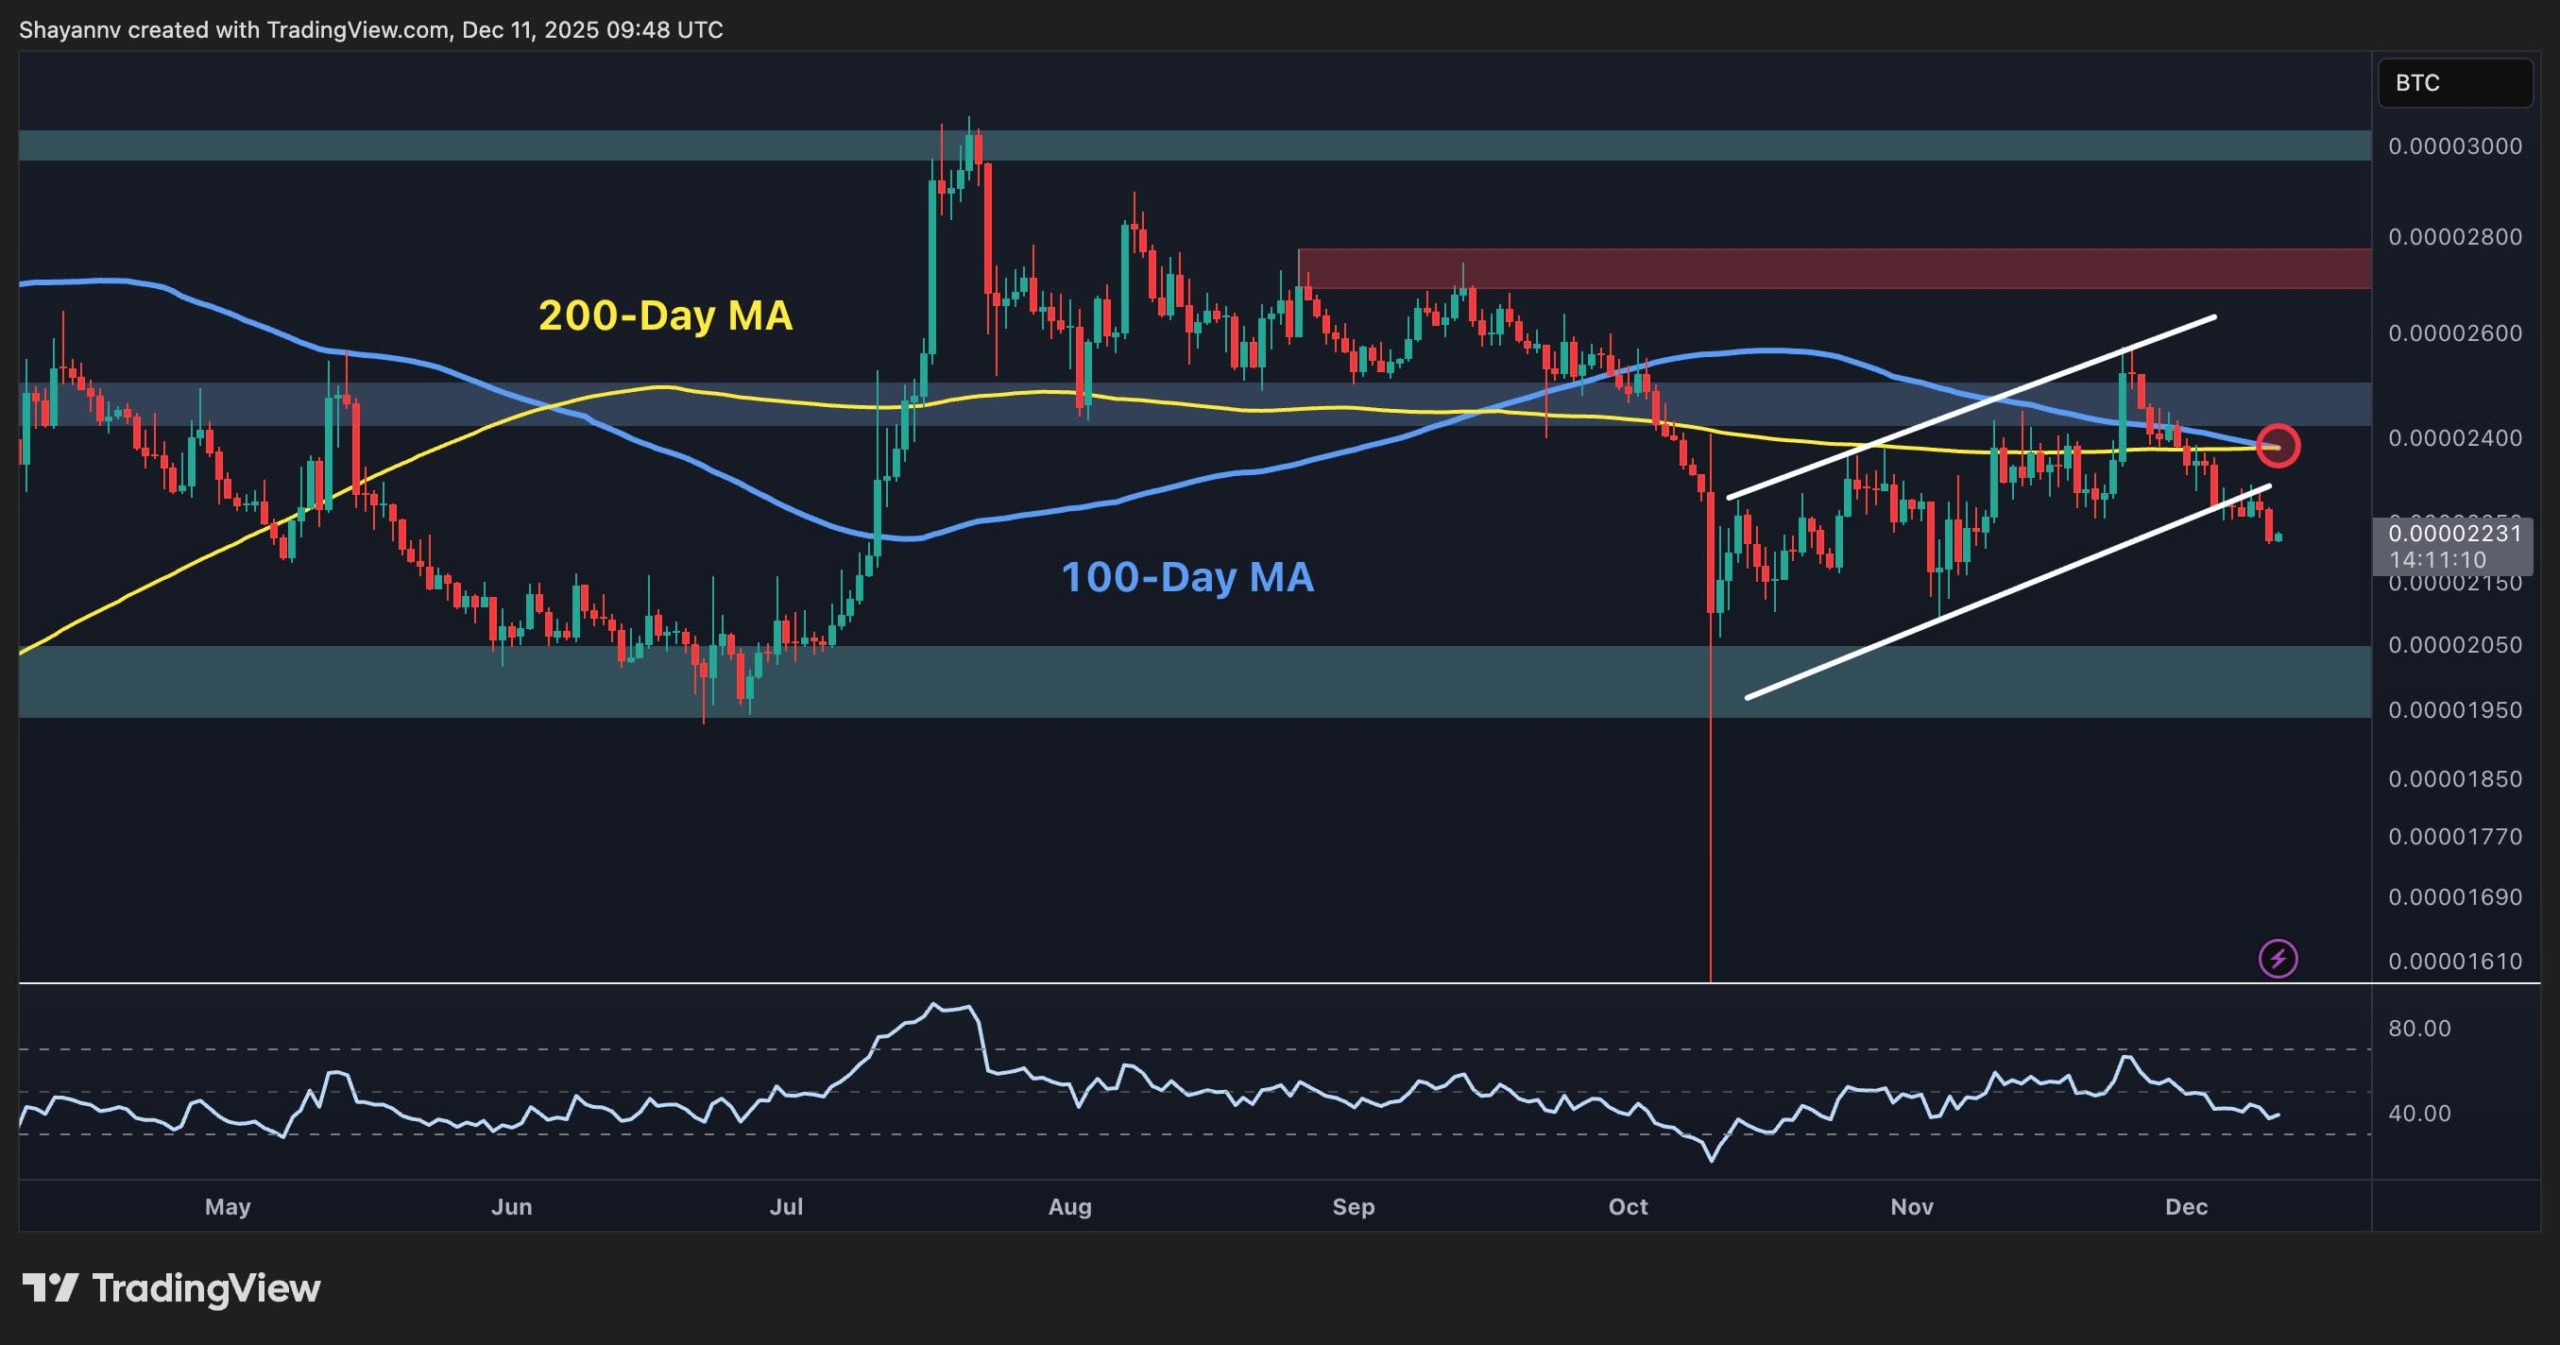
Against Bitcoin, XRP has also broken down from its ascending channel pattern. The break beneath 2,400 sats was a key technical failure, and the pair now sits around 2,230 sats. Both the 100-day and 200-day MAs have flipped into resistance at around the 2,400 sats mark and capped upside attempts in the past week.
This breakdown is particularly concerning since the BTC pair had been consolidating with higher lows, but now that structure is invalid. If this slide continues, the next support lies around 2,000 sats. Overall, there is no strength in this chart right now. Only a slow bleed with no signs of reversal.
 Source: TradingView
The post Ripple Price Analysis: XRP Drops Below $2, is a drop to $1.8 Imminent? appeared first on CryptoPotato.


 24h Most Popular


 Utilities