.png)
XRP ($2.06) has been trading with relatively low volatility in recent weeks, consolidating below key resistance levels as broader market momentum stalls. While the recent bounce from support suggests short-term buyers are still present, the price remains trapped in a range without clear bullish conviction.
Technical Analysis
By Shayan
The USDT ($1.00) Pair
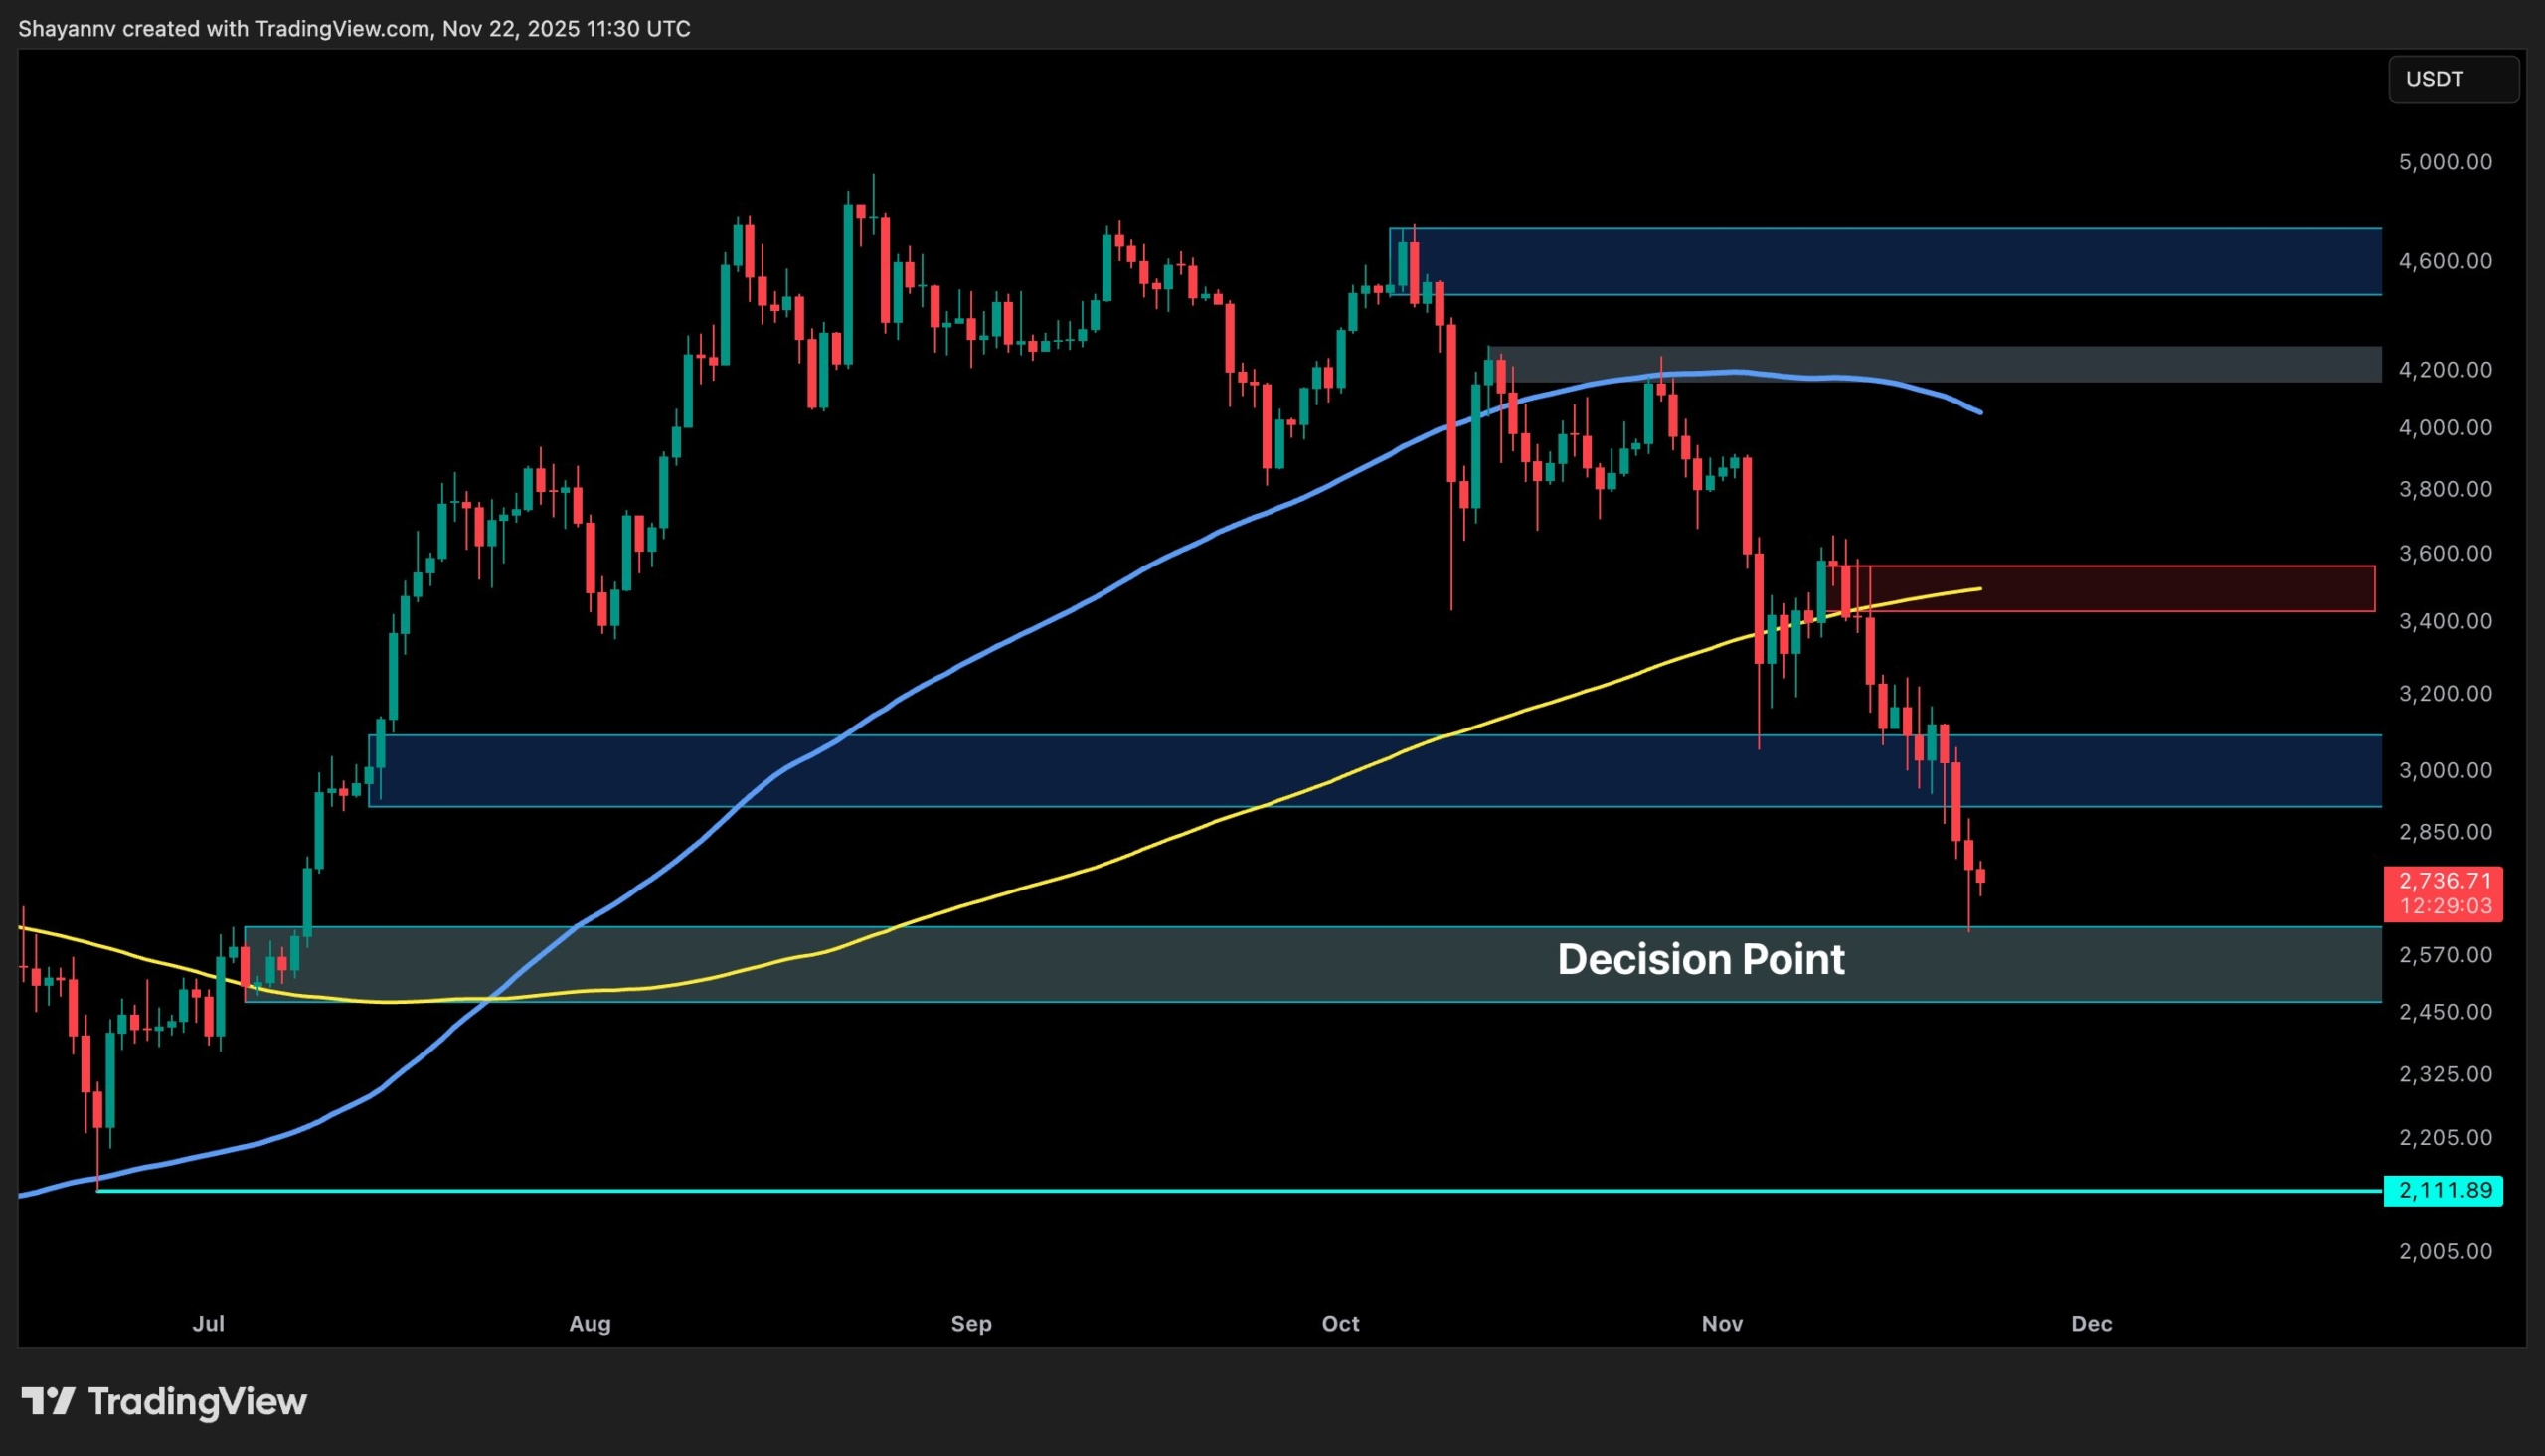
On the USDT pair, XRP is hovering around $2.50, still below the confluence of the 100-day and 200-day moving averages. After the sharp liquidation wick into the demand zone, the asset bounced quickly but failed to break back above the key resistance near $2.60.
The RSI has also flattened out around 45, reflecting weak momentum and a lack of strong bullish drive. Unless the price reclaims the moving averages and breaks above the $2.60–$2.75 zone with volume, the path of least resistance remains sideways to slightly bearish. Regardless, a return to the support level around $2.20 would offer a better risk-reward for buyers.

The BTC ($86,430.00) Pair
Looking at the XRPBTC chart, the price remains under pressure after multiple failed attempts to reclaim key resistance levels. It’s currently trading around 2,270 sats, stuck below the 100-day and 200-day moving averages. This entire structure has been a prolonged accumulation or distribution range, depending on how it resolves.
While the bounce off the 2,000 sat zone shows buyers are still defending key long-term support, there’s little follow-through to suggest strength. The RSI at 47 indicates a neutral momentum, but unless a clean break above 2,500 sats with high volume occurs, XRP continues to lag against Bitcoin.

The post Ripple Price Analysis: XRP’s Path to $3 Still in Doubt Due to This Crucial Resistance appeared first on CryptoPotato.


 24h Most Popular


 Utilities