
</a>-Banner-Option-300x169.jpg)
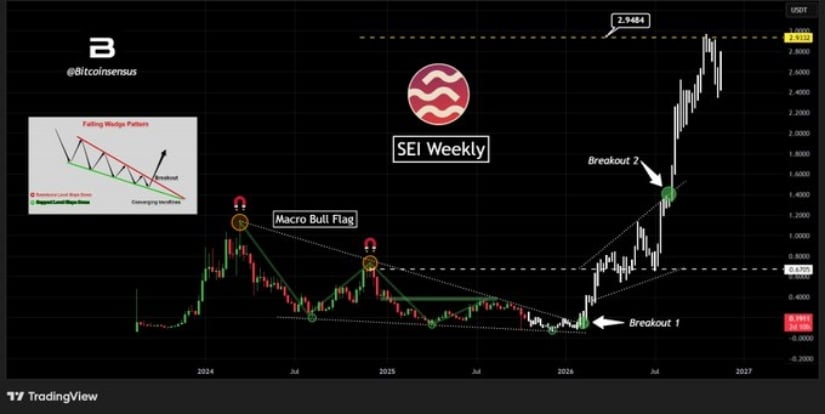
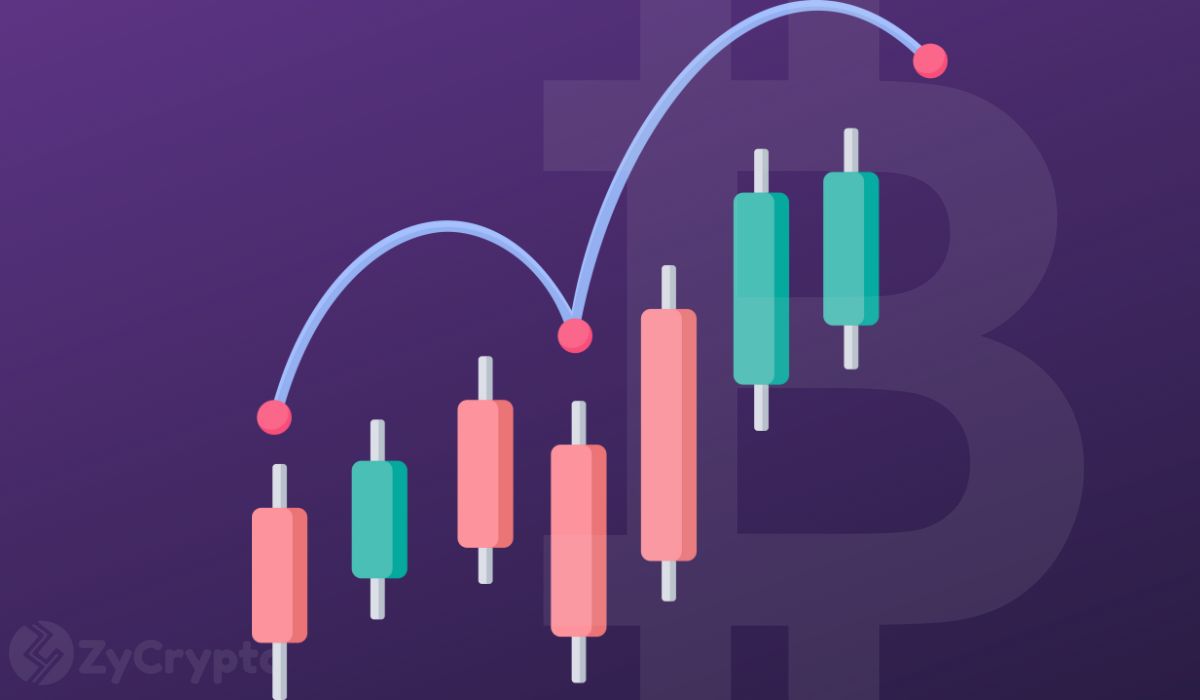
At the time of the analysis, the asset’s weekly chart reflected a gradual tightening of price action, a structure often associated with accumulation phases preceding strong breakouts.
The setup mirrors a potential macro bull flag, indicating that the coin could be nearing the final stage of its corrective phase before a significant upside move begins.
Bullish Structure Developing for SEI
According to the analyst, SEI’s technical formation shows two key breakout zones, Breakout 1 and Breakout 2, which, once validated, could trigger a substantial upward rally. The analyst emphasized that the token remains fundamentally strong but technically undervalued, suggesting that while short-term consolidation may persist, the long-term trajectory favors a bullish continuation.
This perspective aligns with a broader market expectation that the asset could experience a breakout once resistance levels are cleared, paving the way for a potential rally toward the $3 mark.
Source: X
The pattern observed also resembles previous pre-rally structures across altcoins, where compression within wedge formations has historically preceded explosive breakouts. If the crypto manages to reclaim the mid-range resistance and establish higher lows, momentum indicators could confirm the beginning of a sustained bullish leg.
Market Metrics Indicate Stabilization Phase
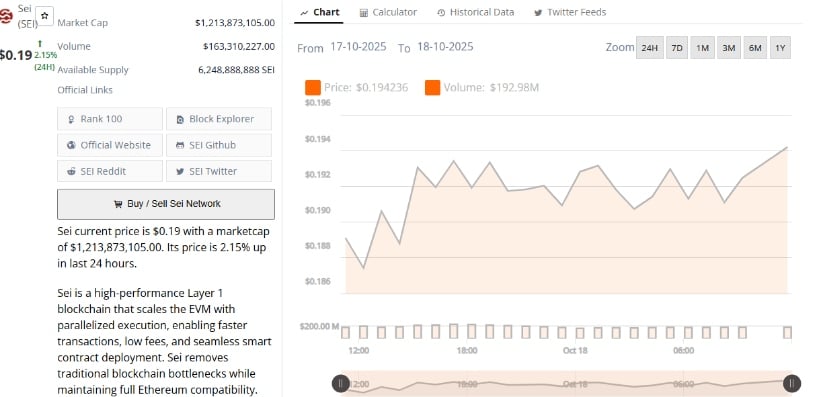
On the other hand, Sei is trading at $0.19, reflecting a 2.15% increase over the past 24 hours. The token holds a market capitalization of $1.21 billion with a daily trading volume of $163.31 million, ranking it 100th globally. With an available supply of 6.24 billion tokens, the market shows stable liquidity despite recent corrections.
Source: BraveNewCoin
This steady performance amid a cooling market underscores resilience, with the coin maintaining a consistent presence among top-performing Layer 1 protocols. Its high-performance blockchain continues to attract developer interest, reinforcing its fundamental outlook even as technical indicators signal consolidation.
Should the current accumulation persist above the $0.18 level, it may serve as a springboard for renewed bullish sentiment once volume expands. Analysts believe a confirmed breakout from the wedge formation could set off a major leg higher, potentially validating the $3 bull run target projected by @Bitcoinsensus.
Technical Indicators Reflect Waning Bearish Pressure
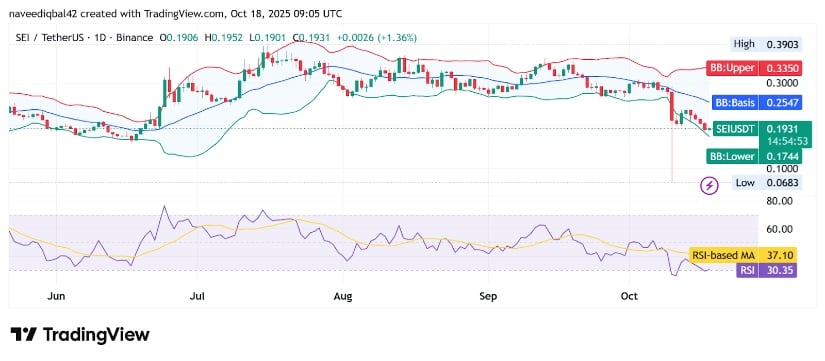
At the time of writing, SEI was trading around $0.1925, up 1.05% on the day, according to TradingView data. The Bollinger Bands show the token hovering near the lower band at $0.1743, with the basis line at $0.2547 and upper resistance at $0.3351. This compression reflects declining volatility and an early stabilization signal following weeks of downside pressure.
Source: TradingView
The Relative Strength Index (RSI) stands at 30.09, while the RSI-based moving average reads 37.08, indicating oversold conditions with early signs of a potential rebound. If RSI momentum crosses above its moving average, it could validate the early stages of a bullish reversal.
Overall, the asset’s technical landscape points to consolidation within a bullish structure. If price action continues to tighten while holding above $0.18, a breakout toward $3 remains plausible contingent on increasing trading volume and confirmation above the wedge resistance zone.


 24h Most Popular


 Utilities