Solana failed to stay above $200 and corrected gains. SOL ($194.42) price is now trading below $200 and might decline further if it dips below $192.
- SOL price started a downside correction below $200 against the US Dollar.
- The price is now trading below $198 and the 100-hourly simple moving average.
- There was a break below a bullish trend line with support at $198 on the hourly chart of the SOL/USD pair (data source from Kraken).
- The pair could extend losses if it dips below the $192 zone.
Solana Price Corrects Some Gains
Solana price started a decent increase after it settled above the $192 zone, beating Bitcoin and Ethereum. SOL climbed above the $198 level to enter a short-term positive zone.
The price even smashed the $200 resistance. A high was formed near $205 and the price recently corrected some gains. There was a move below the 23.6% Fib retracement level of the upward wave from the $177 swing low to the $205 high.
Besides, there was a break below a bullish trend line with support at $198 on the hourly chart of the SOL/USD pair. Solana is now trading below $198 and the 100-hourly simple moving average.
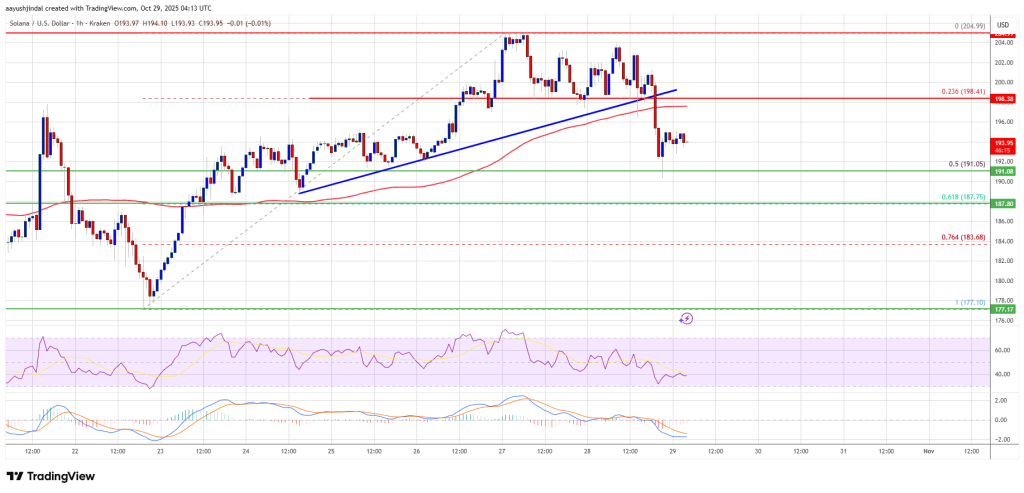
On the upside, the price is facing resistance near the $198 level. The next major resistance is near the $200 level. The main resistance could be $205. A successful close above the $205 resistance zone could set the pace for another steady increase. The next key resistance is $212. Any more gains might send the price toward the $220 level.
More Losses In SOL?
If SOL fails to rise above the $200 resistance, it could start another decline. Initial support on the downside is near the $192 zone and the 50% Fib retracement level of the upward wave from the $177 swing low to the $205 high. The first major support is near the $188 level.
A break below the $188 level might send the price toward the $180 support zone. If there is a close below the $180 support, the price could decline toward the $166 support in the near term.
Technical Indicators
Hourly MACD – The MACD for SOL/USD is gaining pace in the bearish zone.
Hourly Hours RSI (Relative Strength Index) – The RSI for SOL/USD is below the 50 level.
Major Support Levels – $192 and $188.
Major Resistance Levels – $200 and $205.


 24h Most Popular


 Utilities