
Stellar (XLM ($0.30)) has spent the past month in decline, dropping 14.7% as broader market sentiment weakened. Over the past week, though, the XLM price has traded mostly flat — hinting that the correction could be nearing an end.
A few key on-chain and technical indicators now suggest that XLM’s buyer-seller standoff might soon break in favor of the bulls. Read on to know how!
The Buyer-Seller Battle Is Visible
On the daily chart, XLM trades inside a symmetrical triangle — a pattern that forms when buyers and sellers are evenly matched. It reflects indecision, where lower highs and higher lows compress price into a tighter range before a breakout.
The current pattern shows that both the upper and lower trendlines of the triangle have just two touchpoints each, making the structure relatively weak on both sides. This setup suggests that a breakout could occur with the slightest push, whether from buyers or sellers.
Because neither side has established firm control, even a short burst of momentum could decide the next direction. The formation captures a true buyer-seller stalemate, where each minor price swing tests conviction but fails to confirm a clear trend. In short, the next breakout may depend on which side acts first, not necessarily which side is stronger.
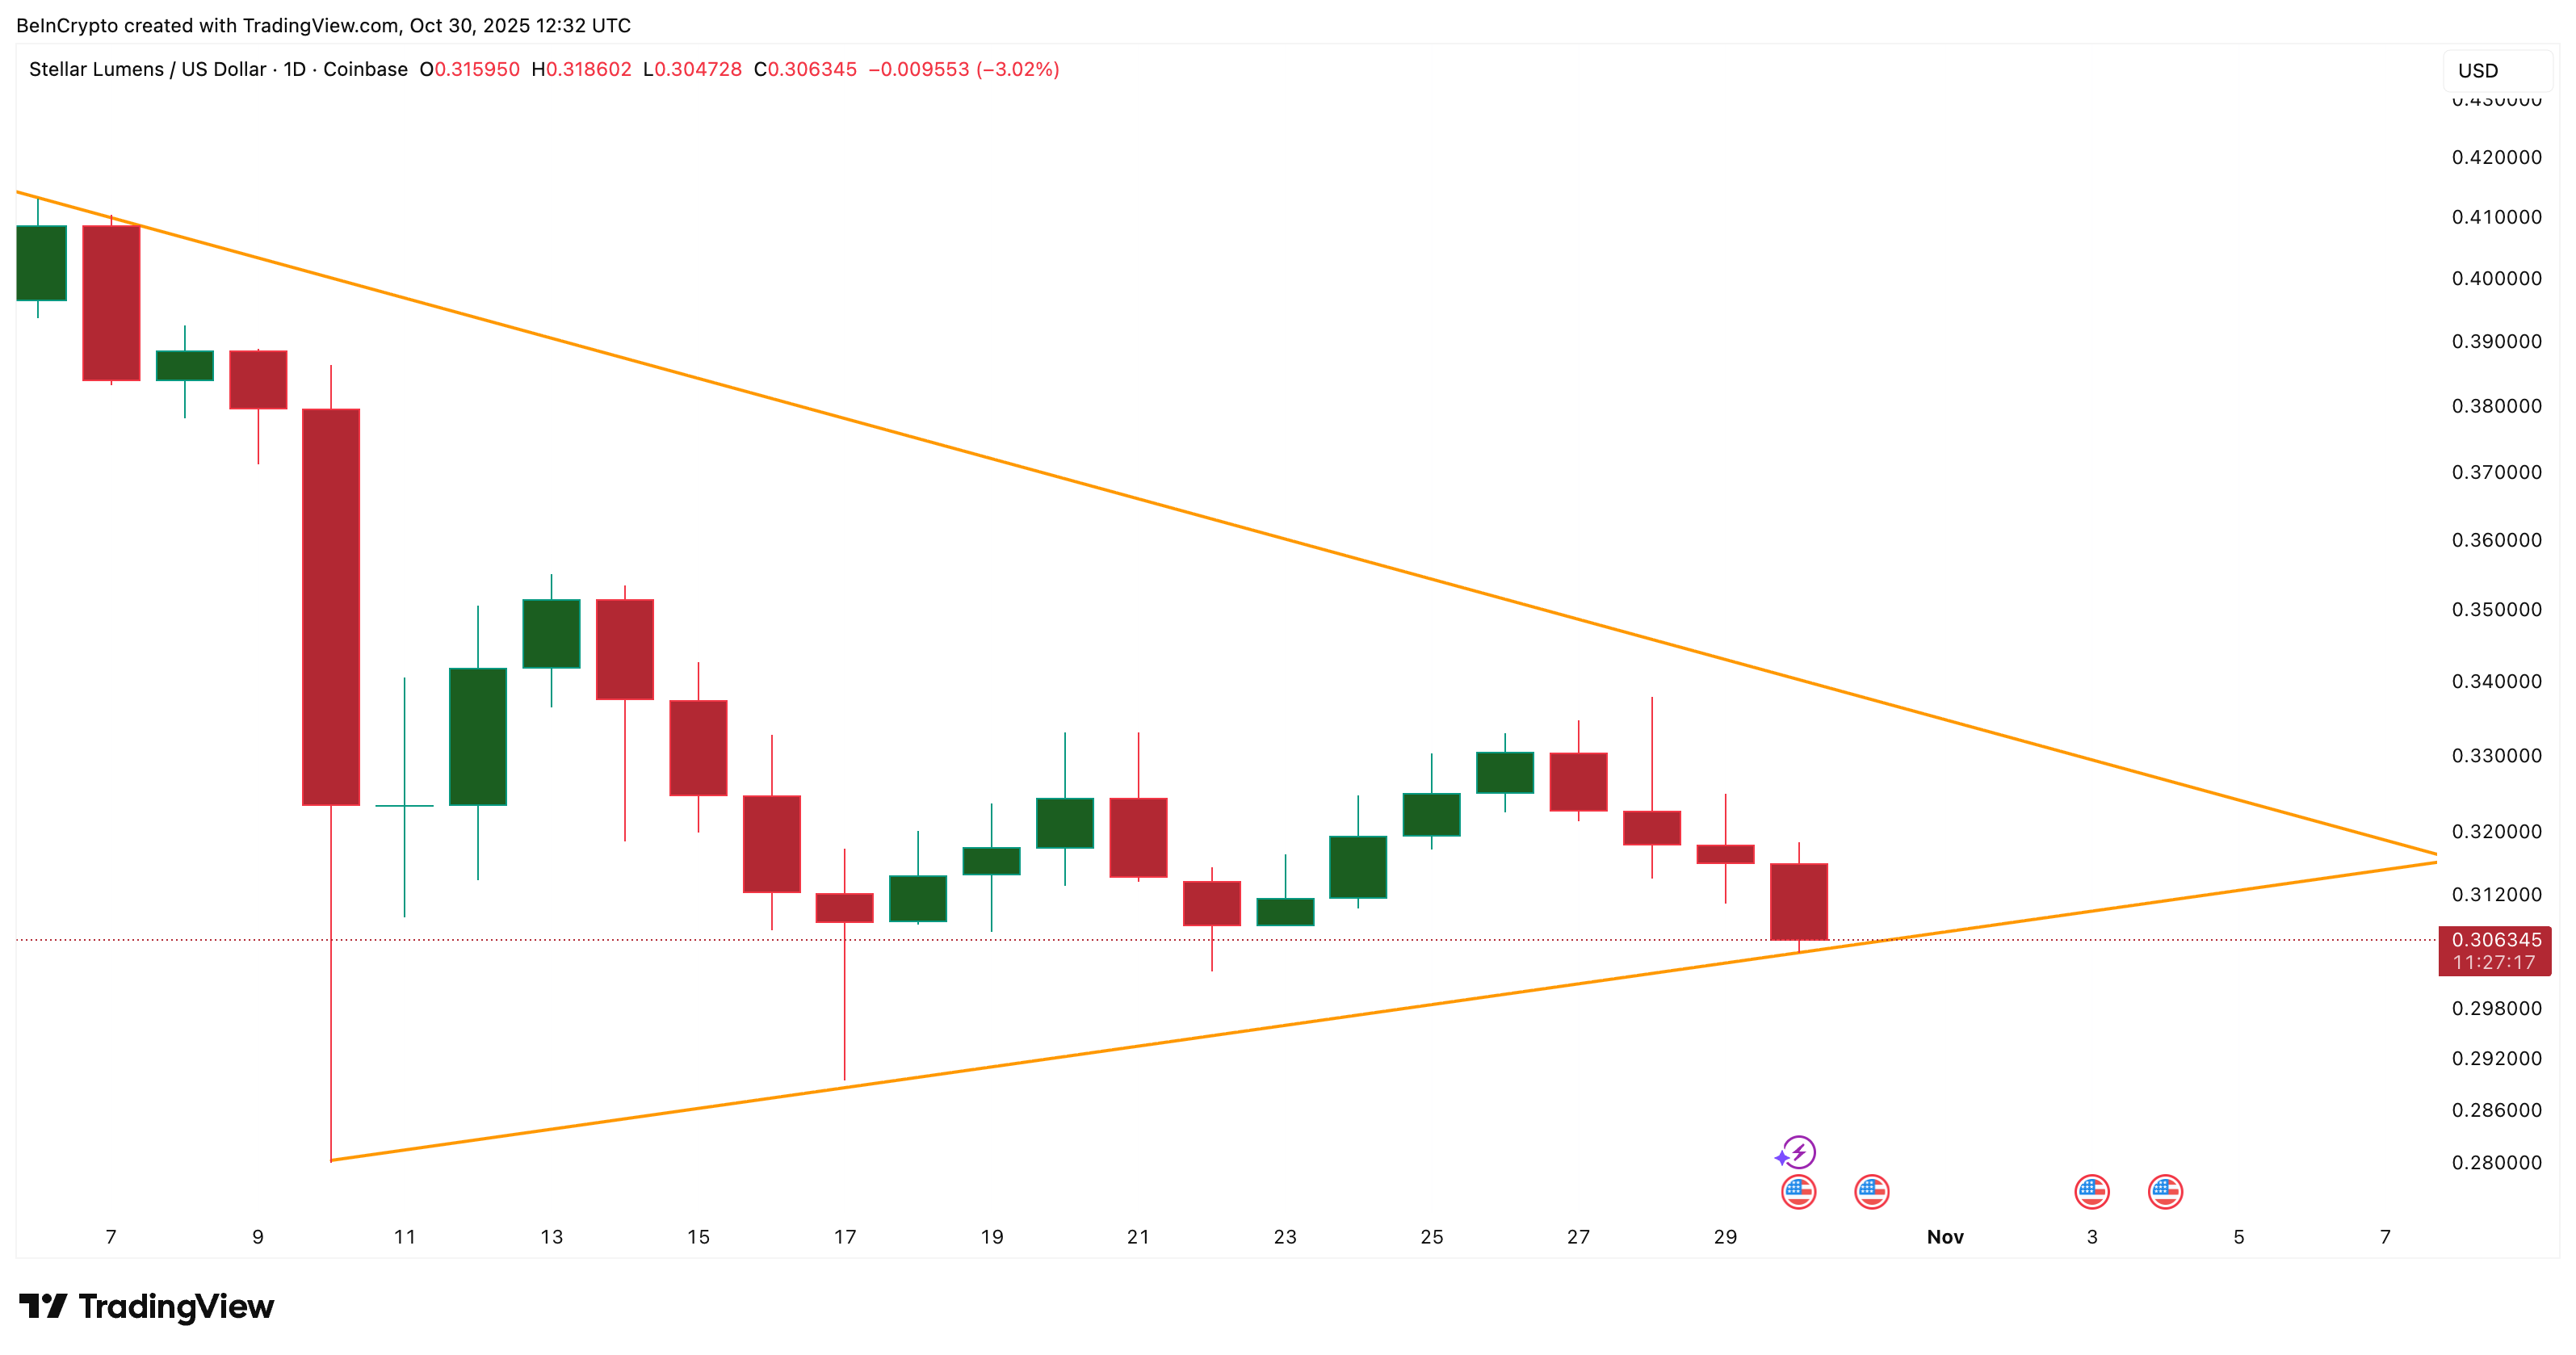 XLM’s Buyer-Seller Standoff: TradingView
Want more token insights like this? Sign up for Editor Harsh Notariya’s Daily Crypto Newsletter here.
The setup comes after a three-month decline of over 19%, so even a modest rebound could mark the start of a larger recovery phase if momentum builds.
Selling Pressure Is Fading Fast
The Wyckoff Volume Chart — which tracks buying and selling dominance through color-coded bars — supports this reading. The yellow bars, representing selling activity, have been steadily shrinking since yesterday. This reduction shows that sellers are gradually stepping back while buyers begin to absorb available supply.
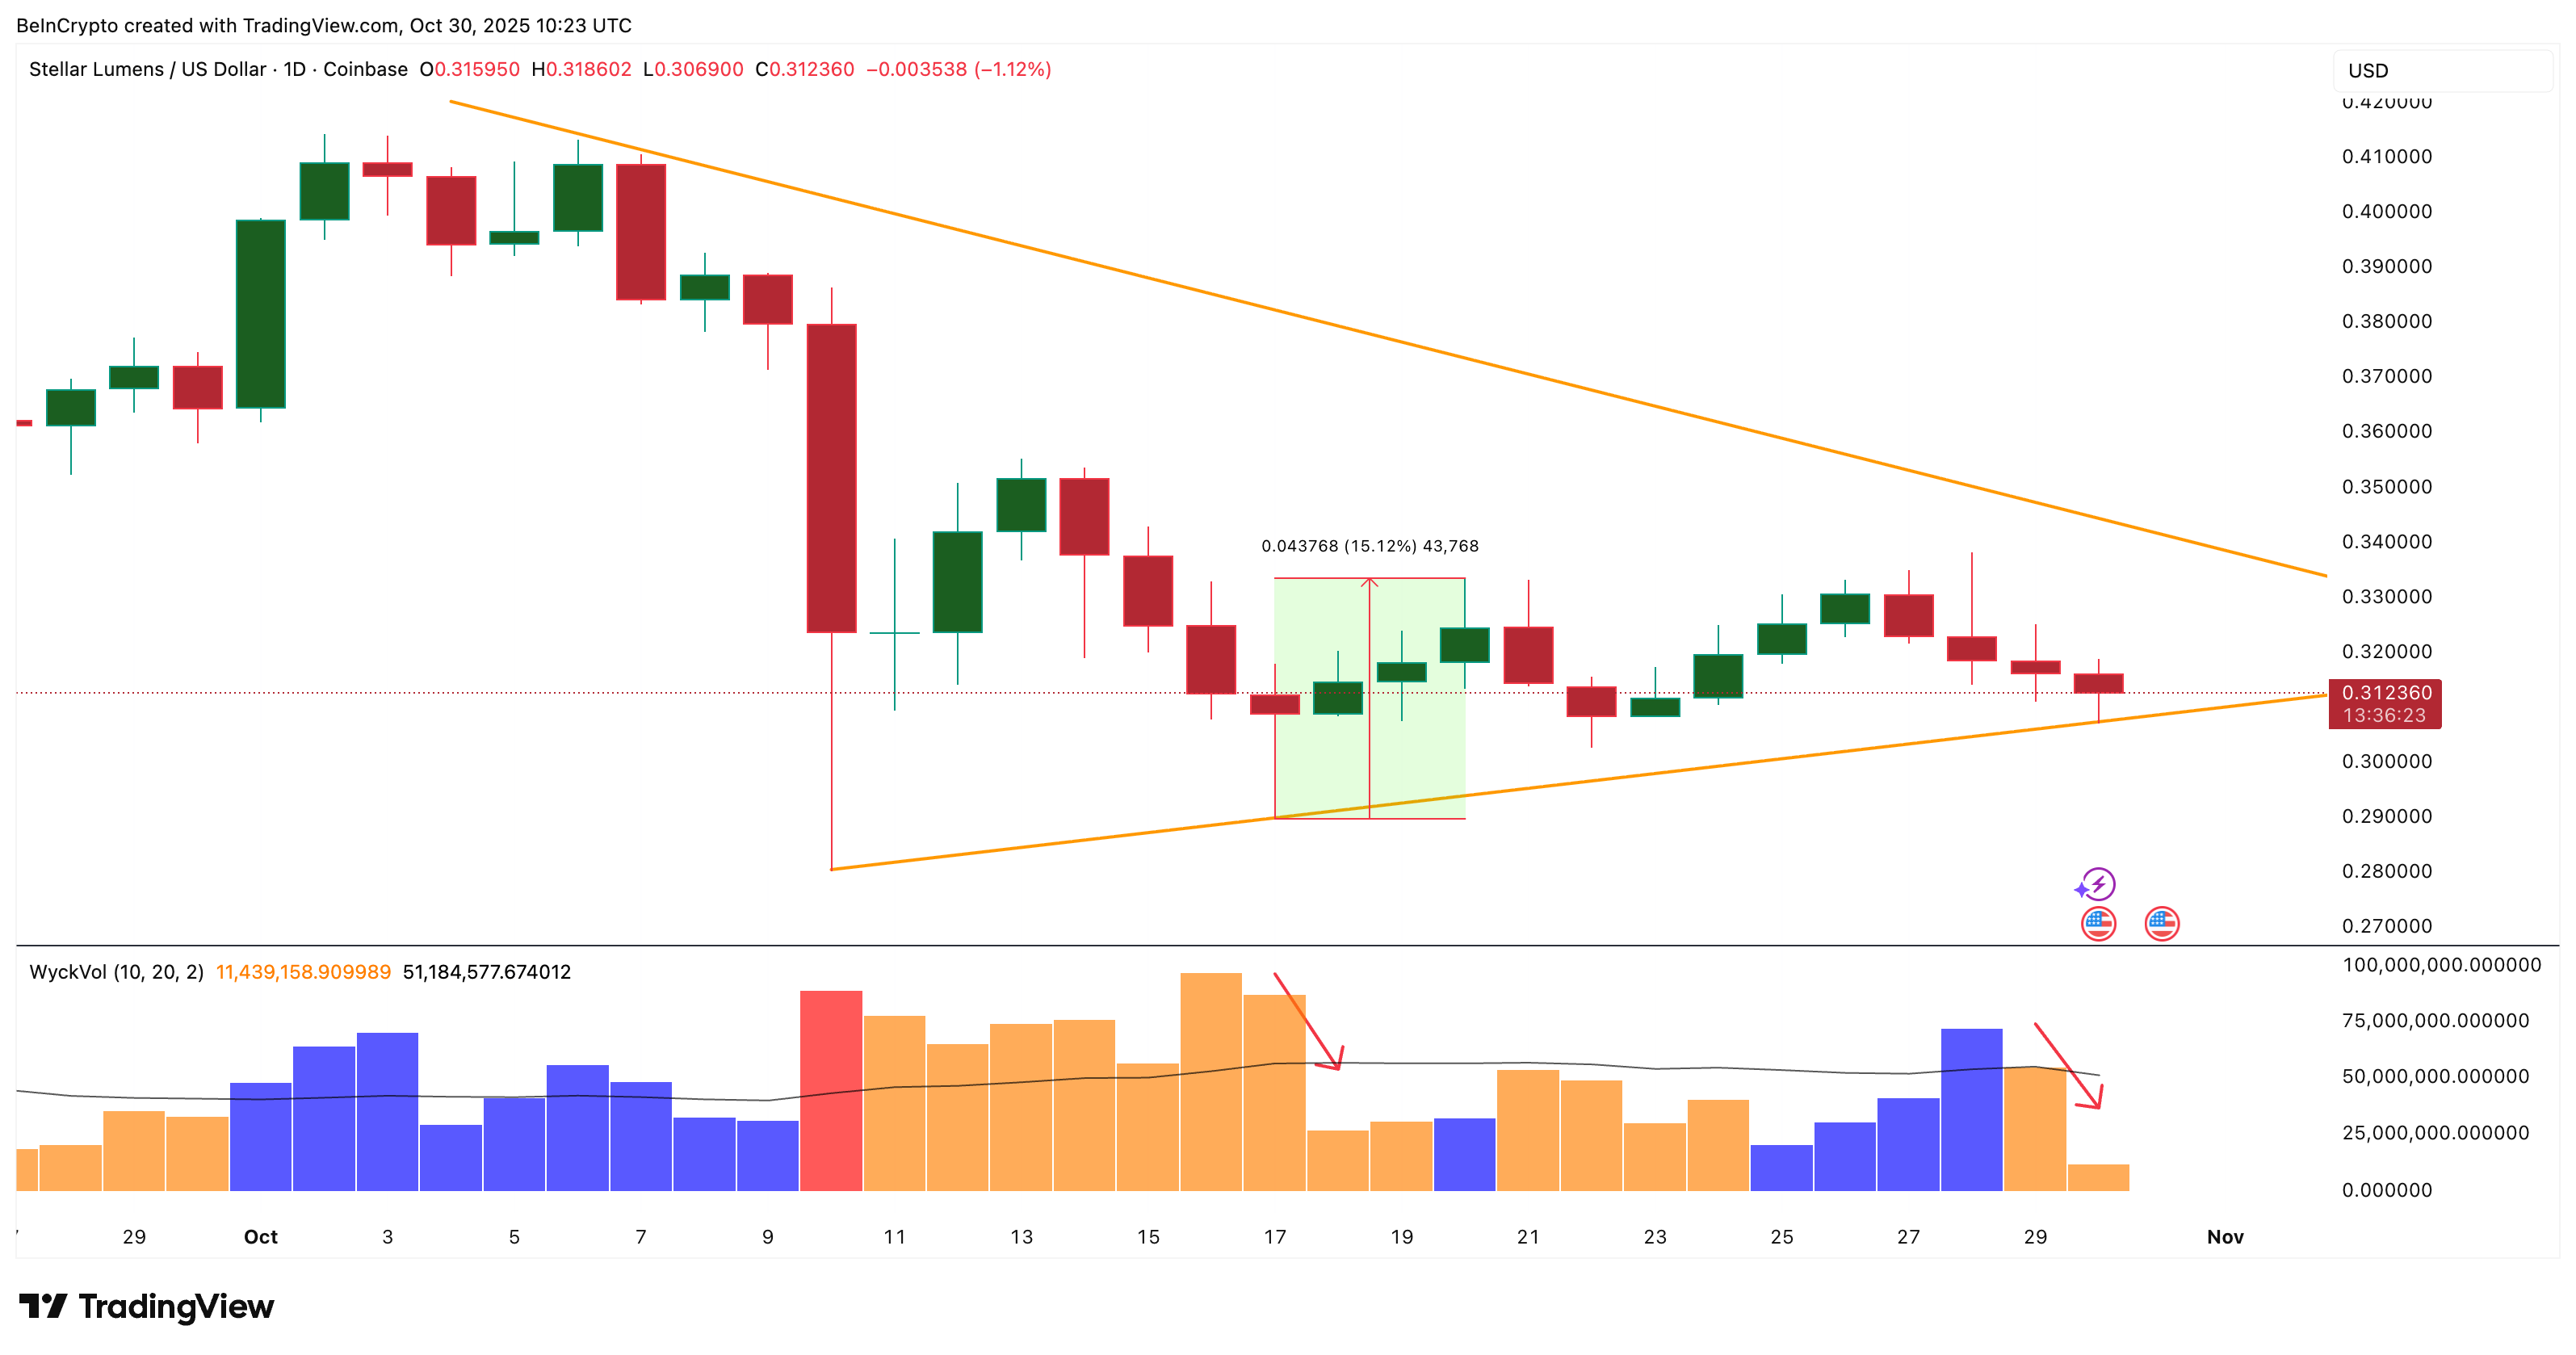 Selling Pressure Is Fading Fast: TradingView
Interestingly, a similar pattern appeared between October 17 and 18, when reduced selling volume preceded a 15.1% XLM price rise soon after. The same structure now seems to be re-forming, reinforcing the idea that downside exhaustion is near. However, for a complete confirmation of seller-specific weakness, blue or green bars need to show up.
Key Levels to Watch For The XLM Price Rebound
Zooming into the chart, the XLM price continues to respect the triangle’s lower trendline, indicating that $0.30 remains a strong support level. If prices hold above $0.30, this level, a move toward $0.33 is likely, completing a 7.8% recovery.
Breaking above $0.33 could open the path to $0.35 and eventually $0.39. Do note that while a push past $0.33 breaks the triangle’s upper trendline, it is already considered equally weak, as the line has only two touchpoints.
That shows, if the XLM price peaks, breaking on the upside could be easier than breaking down.
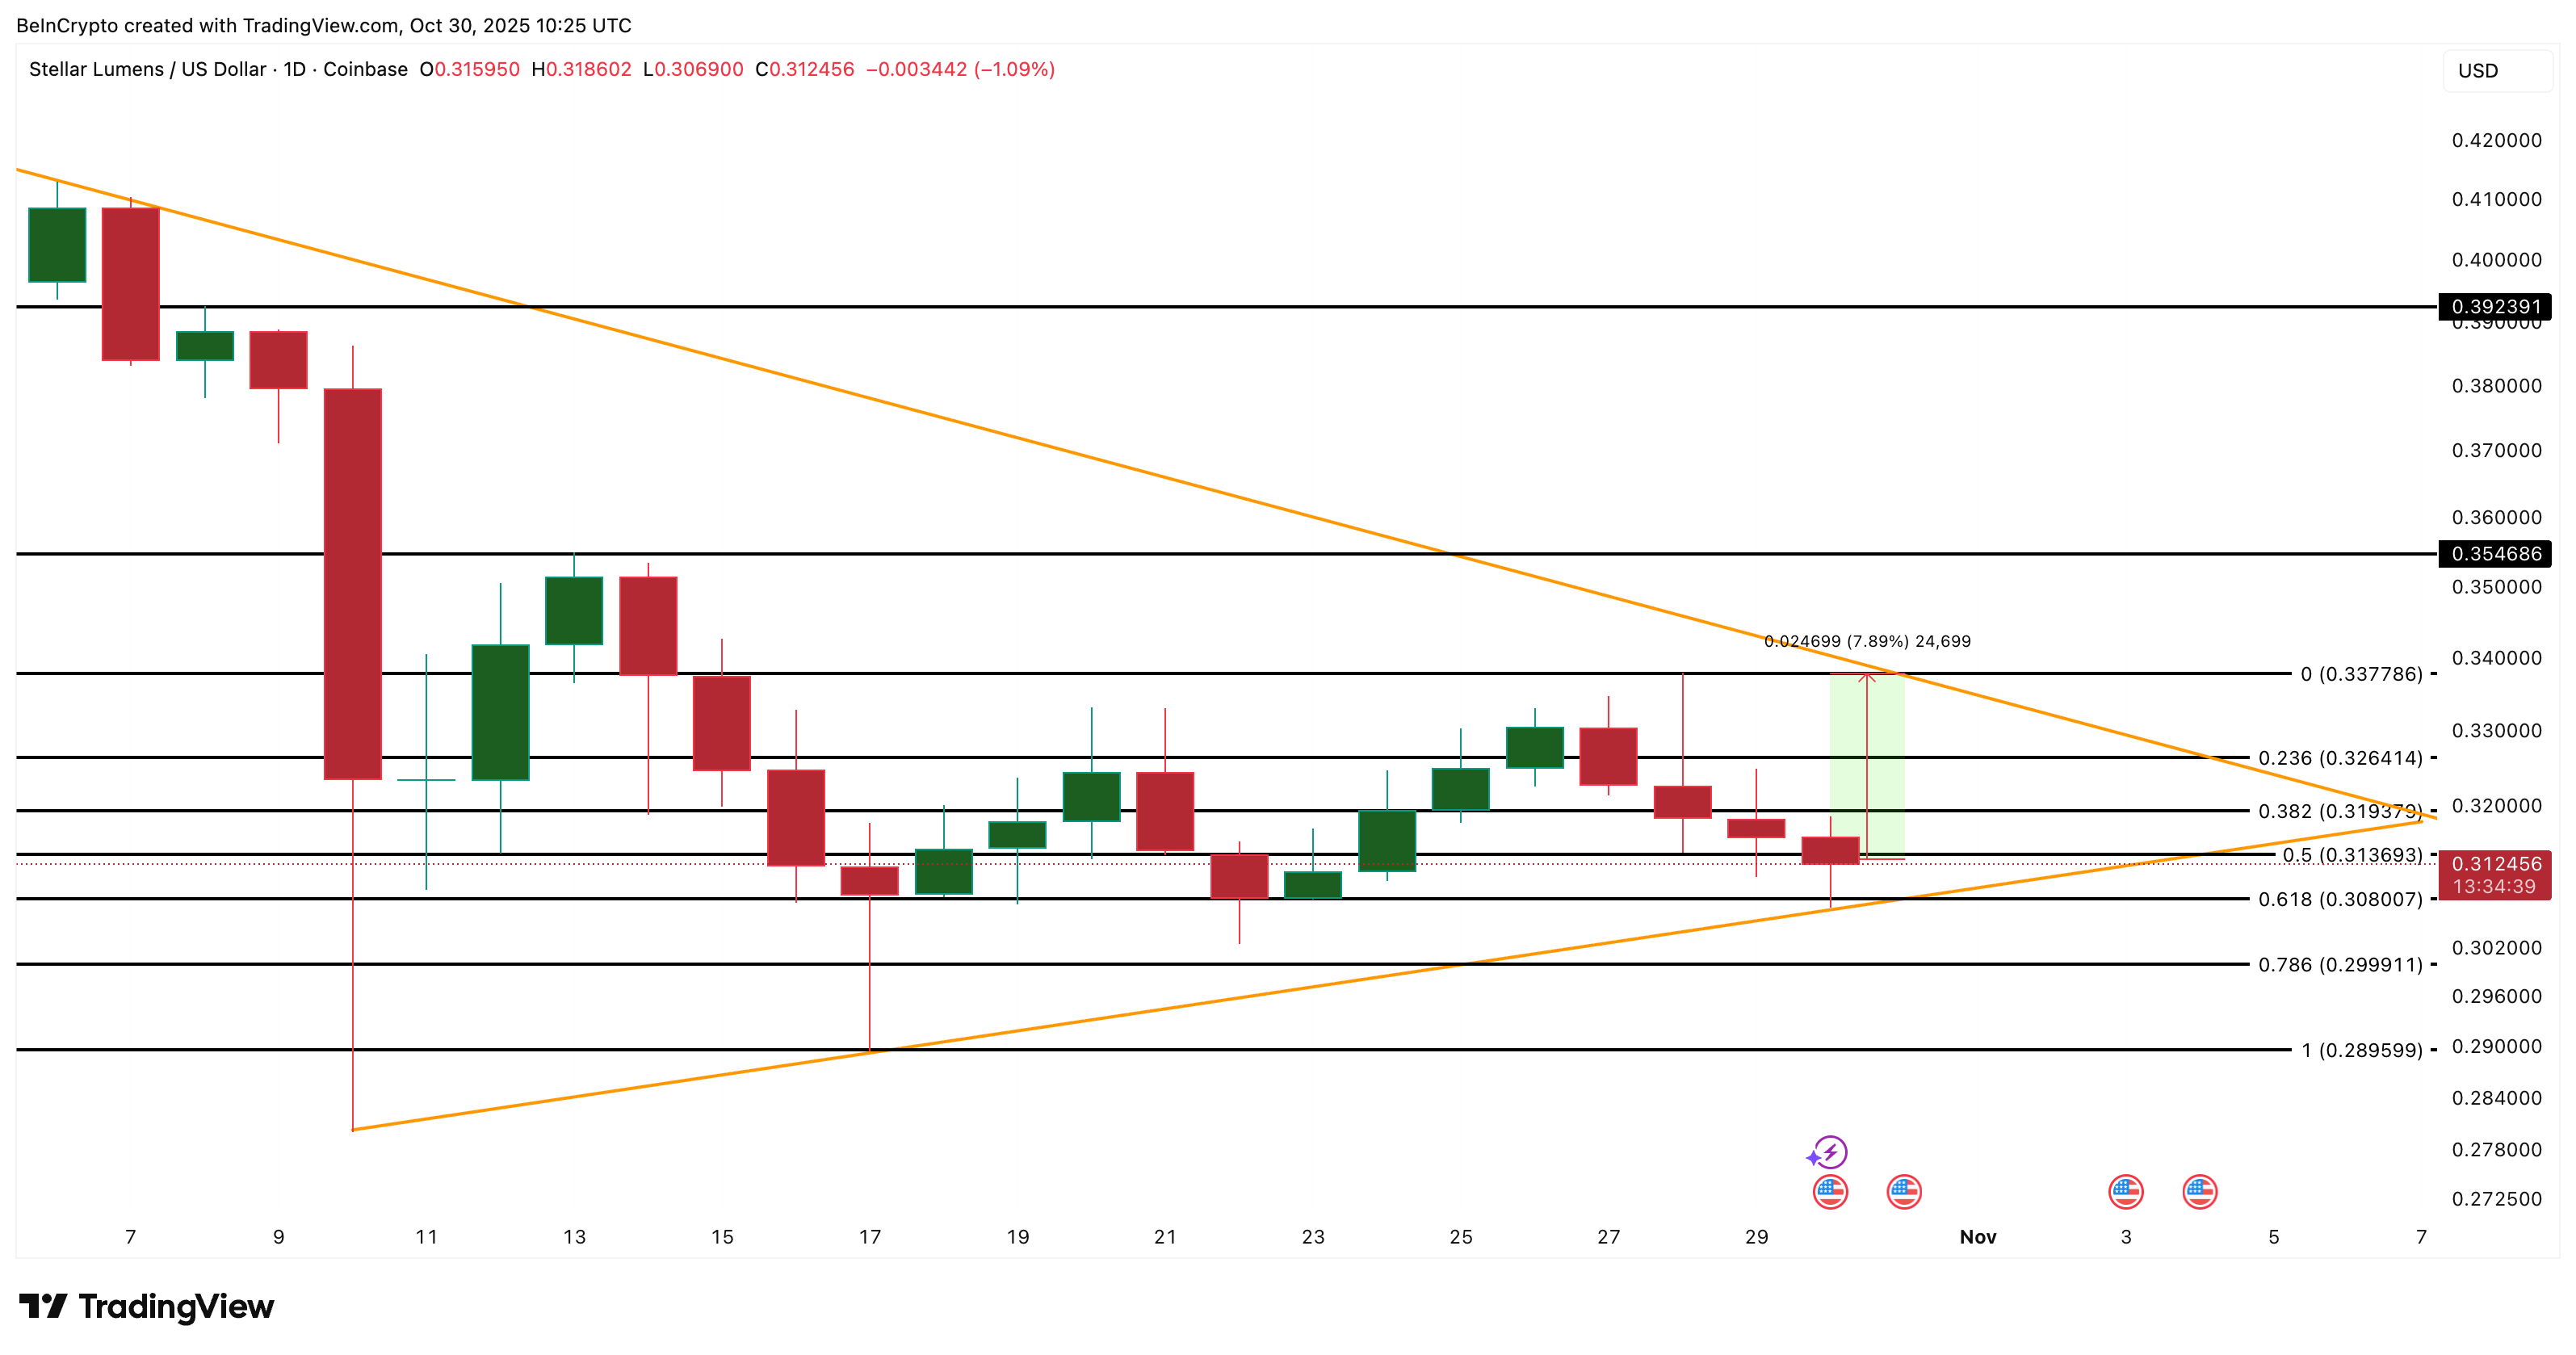 XLM Price Analysis: TradingView
However, if XLM loses $0.30, the next key support lies near $0.28. However, breaking $0.30 would mean a trendline breakdown, and that could push the XLM price lower.
For now, fading Wyckoff selling signals and a steady base near $0.30 show optimism. That means buyers might finally be regaining control of the Stellar (XLM) price structure, provided the market conditions do not worsen.
The post Stellar (XLM) Buyer-Seller Standoff Could Be Ending And This Side Is About to Lose appeared first on BeInCrypto.


 24h Most Popular


 Utilities