.png)
XRP ($1.90) is now trading near $1.88 after dropping below a key support level that had held for most of the year. The move places the asset under pressure as traders watch how the weekly candle closes.
Over the past seven days, Ripple’s token has lost almost 8%. Daily trading volume is over $3.4 billion, with the price falling about 2% in the last 24 hours.
XRP Breaks Below Key Support Zone
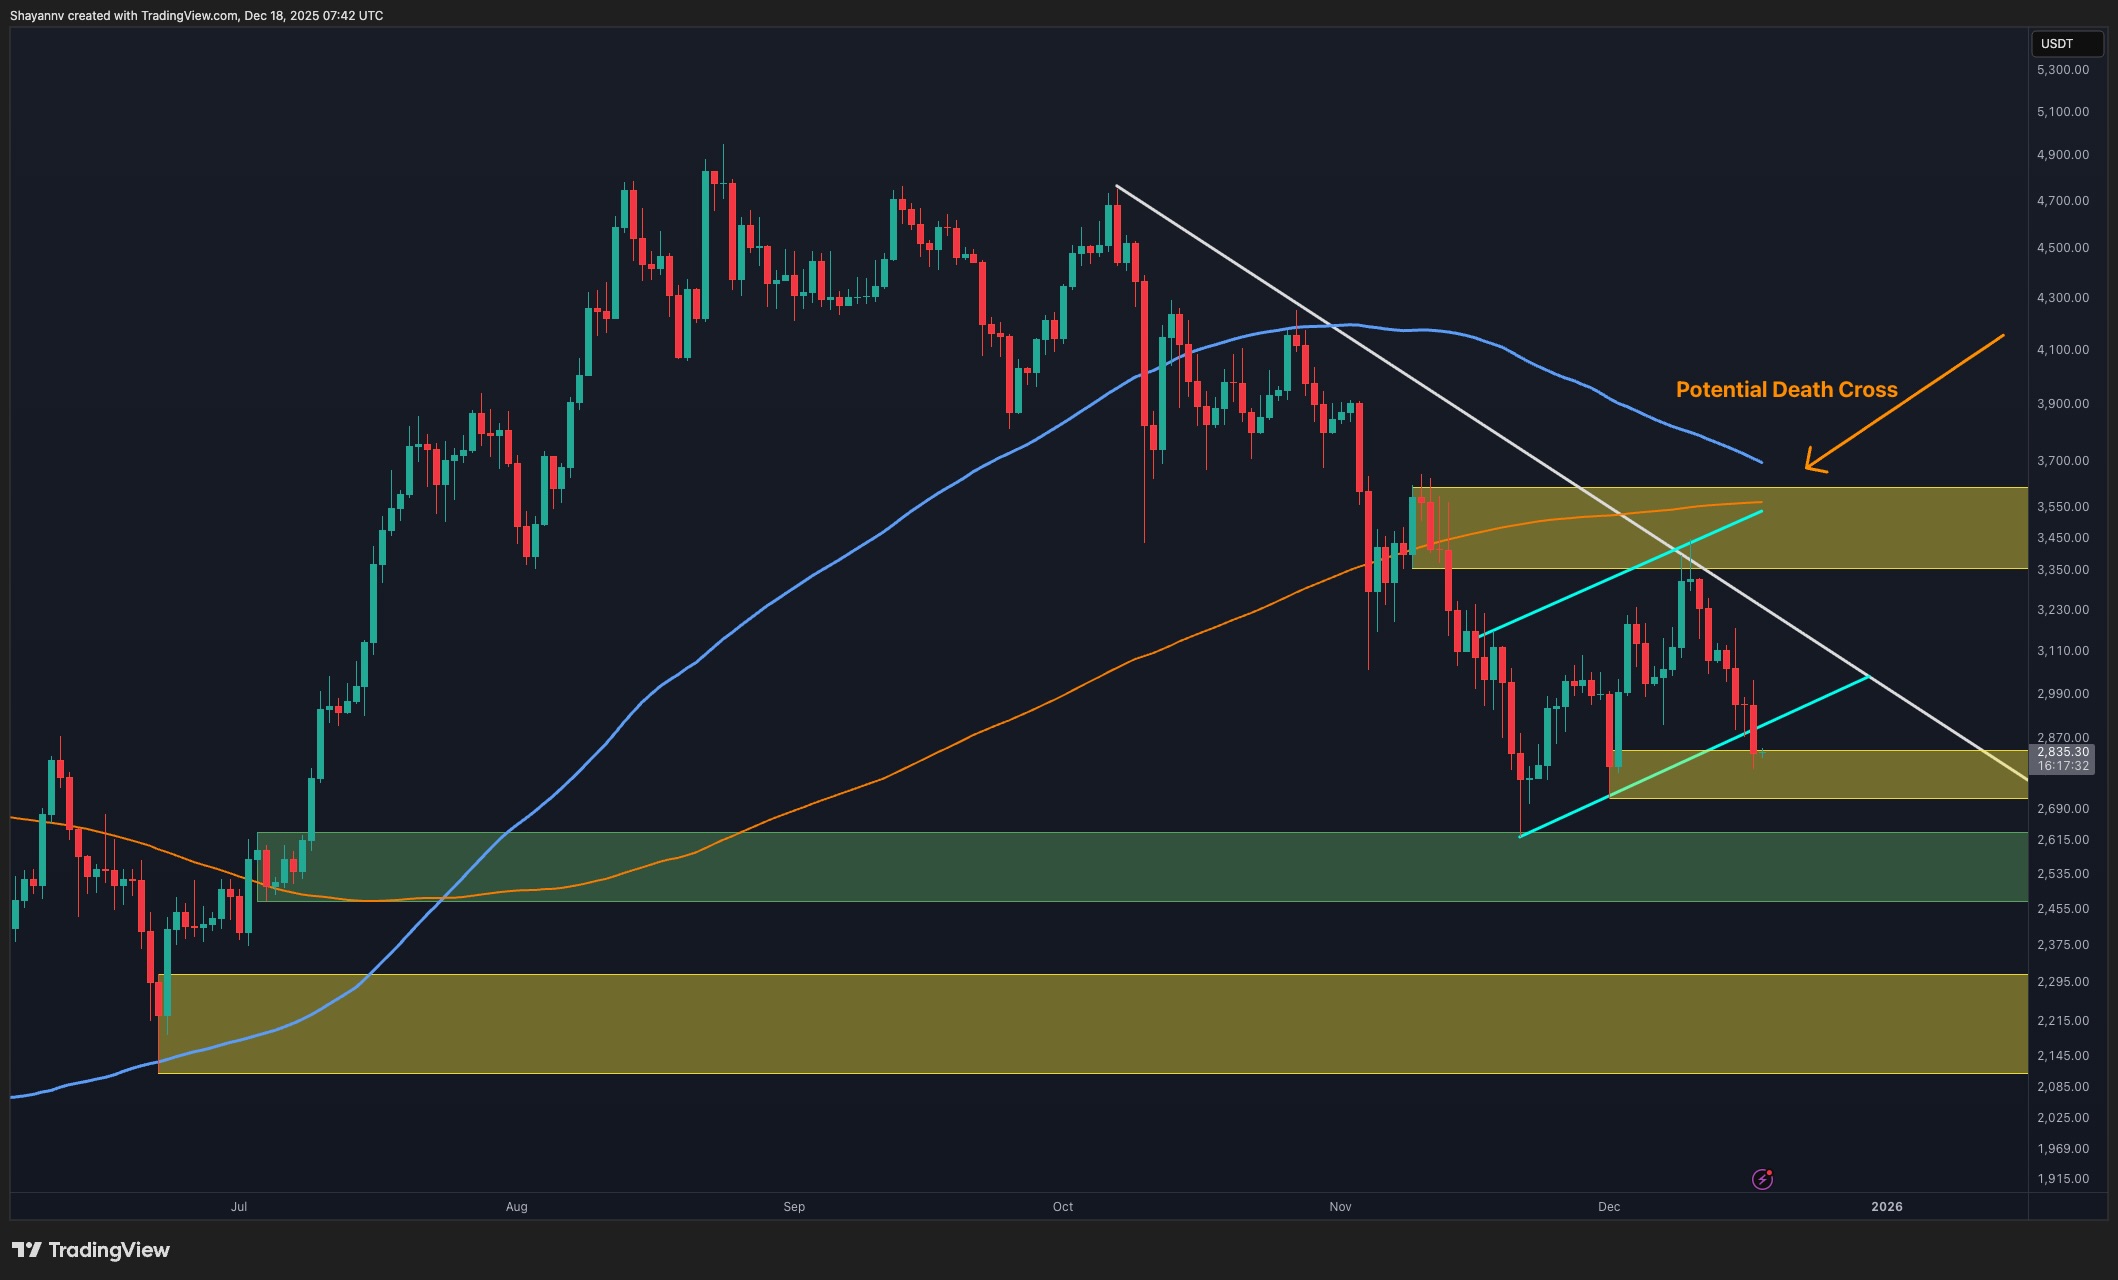
XRP has dropped below its multi-month support trendline for the first time this year. The zone previously acted as a launch point for several strong bounces, including multiple V-shaped recoveries earlier in 2025.
However, the recent decline has pushed the price below $2, and it has remained under that level for several days, confirming what analysts are calling a technical breakdown. ChartNerd wrote,
$XRP is sweeping below its multi-month support trendline. It must reclaim this level by this weeks candle close or risk deeper water. Bulls have to step in soon  pic.twitter.com/rD6IgC8yTZ
—  ChartNerd
  (@ChartNerdTA) December 17, 2025
Meanwhile, the support area has been honored multiple times since March, yet there has been no strong response to the current candles. The charts show that moving averages are falling, evidence of less favorable price behavior and bearish pressure.
Pattern Breakdown or Setup for Recovery?
Veteran trader Peter Brandt has identified a possible double-top pattern on XRP’s weekly chart. This structure includes two local peaks with a support level near $2 acting as the neckline. He warned,
“This is a potential double top. Sure, it may fail, and I will deal with this if it does.”
A failure to reclaim the $2 level could open the door to a further move down toward $1. Still, the market may not follow this pattern fully. With the Relative Strength Index (RSI) near 37 on the weekly chart (per TradingView), XRP is entering a range often associated with short-term rebounds. While no reversal is confirmed, trader sentiment remains divided.
Historical Signals and ETF Interest
According to Steph Is Crypto, XRP has a history of strong rallies following prolonged periods below the 50-week simple moving average. He noted that during past cycles—2017, 2021, and 2024—XRP spent between 49 and 84 days below the average before rebounding, with gains ranging from 70% to 850%. He added,
“Right now, XRP is sitting inside the same historical window.”
Institutional interest also continues to grow. Spot XRP ETFs have reported $19 million in net purchases, according to SoSoValue data. The first US-based spot XRP ETF launched over a month ago, with consistent inflows since then. Although the inflow pace has slowed, the streak of positive net activity remains unbroken.
To restore short-term momentum, bulls must move XRP above the recent high of $2.27, which was last hit in late November. The next support level is close to $1, and traders are monitoring it in case of further selling pressure.
The post XRP Crash Warning as Ripple’s Price Slips Below Multi-Month Support appeared first on CryptoPotato.


 24h Most Popular


 Utilities