
XRP ($2.48) entered November with little activity. The XRP price has been trading flat over the past 24 hours with a mild 0.6% gain at press time. While that may seem uneventful, the charts and on-chain data tell a different story.
A bullish pattern is tightening, selling pressure is falling, and XRP now sits 2% away from its “glory zone” — the level that could decide whether this calm start turns into something far bigger.
Cost Basis Heatmap and Exchange Data Set the Stage
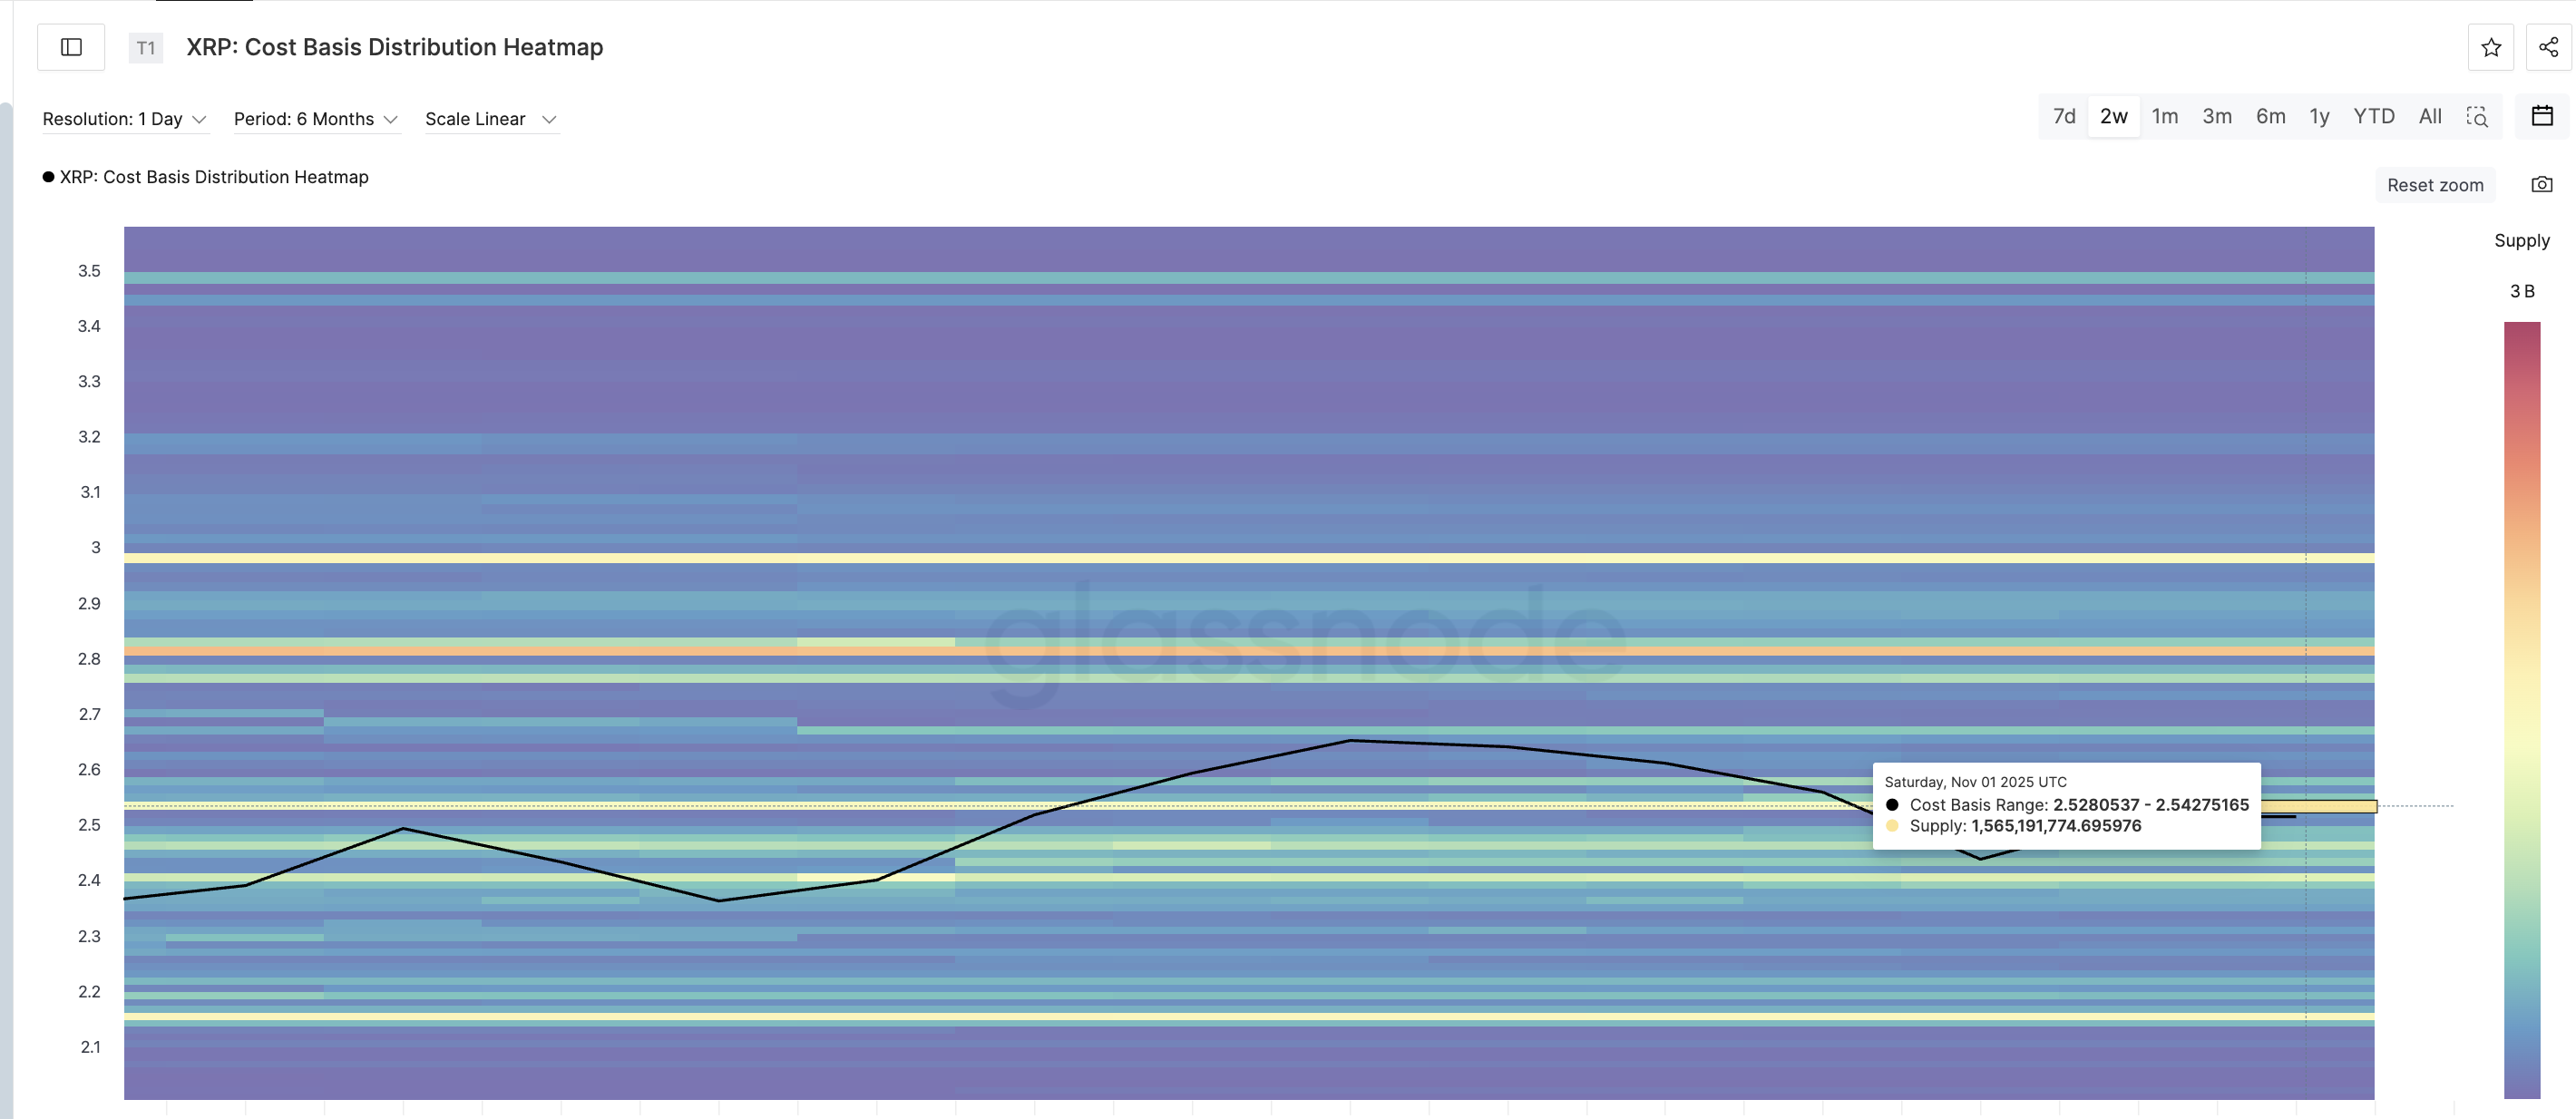
The cost basis distribution heatmap — a chart that shows where investors last bought XRP — highlights a dense cluster of holder activity between $2.52 and $2.54. This is the zone around which 1.56 billion XRP were last accumulated. These cost-heavy zones often act as barriers, as many holders sell when prices return to their buy level.
But this time, the market behavior is shifting.
Want more token insights like this? Sign up for Editor Harsh Notariya’s Daily Crypto Newsletter here.
 XRP Supply Cluster: Glassnode
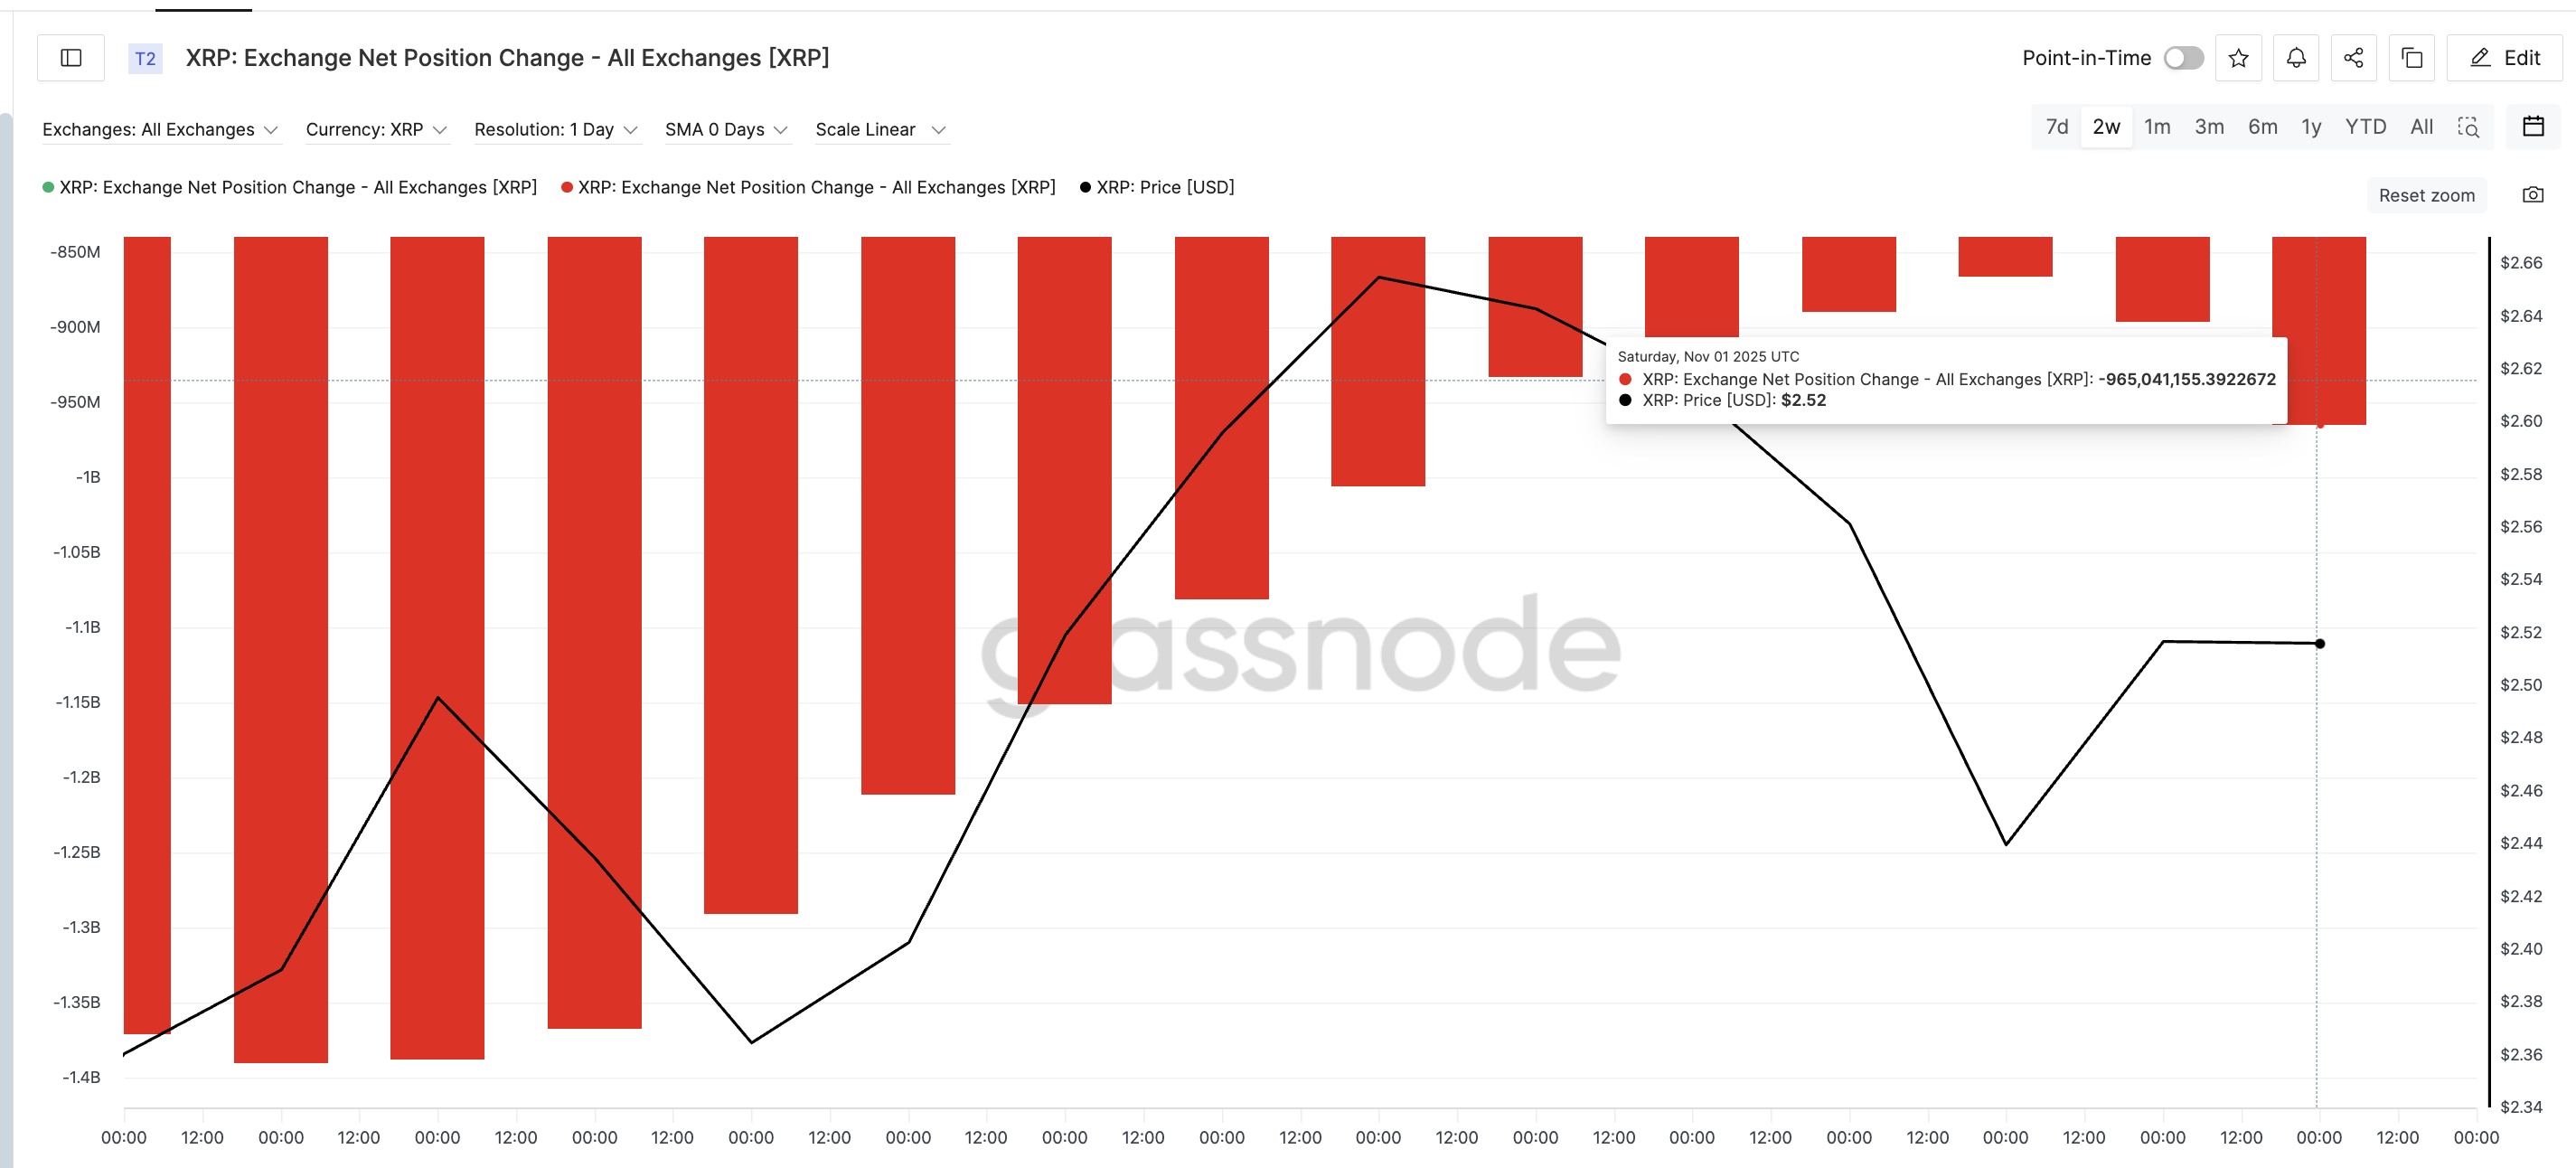
According to Glassnode, XRP’s exchange net position change — which tracks whether tokens are moving into or out of exchanges — fell from –866 million XRP on October 30 to –965 million XRP on November 1, marking an 11.4% increase in outflows.
 Buyers Are Coming Back: Glassnode
That means sellers are sending fewer coins into the exchanges, and more are being pulled into wallets for holding. Such rising outflows near a key resistance often signal accumulation, suggesting traders are expecting strength ahead rather than preparing to exit.
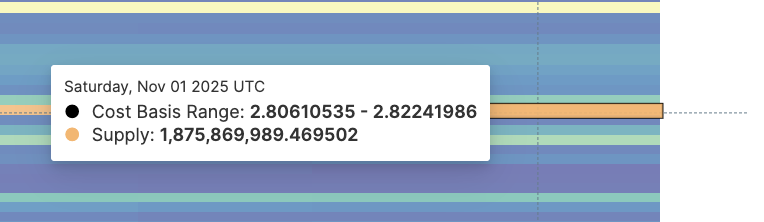
If XRP manages to clear the $2.54 zone, the next significant supply wall stands at a much higher level. That’s between $2.80 and $2.82, where another 1.87 billion XRP were last purchased.
 A Higher XRP Supply Cluster: Glassnode
However, to go that high, the $2.54 level or the “glory zone” needs to give. That could then confirm the upside momentum. The XRP price chart, discussed next, also highlights that.
XRP Price Pattern Aligns With the 2% Threshold
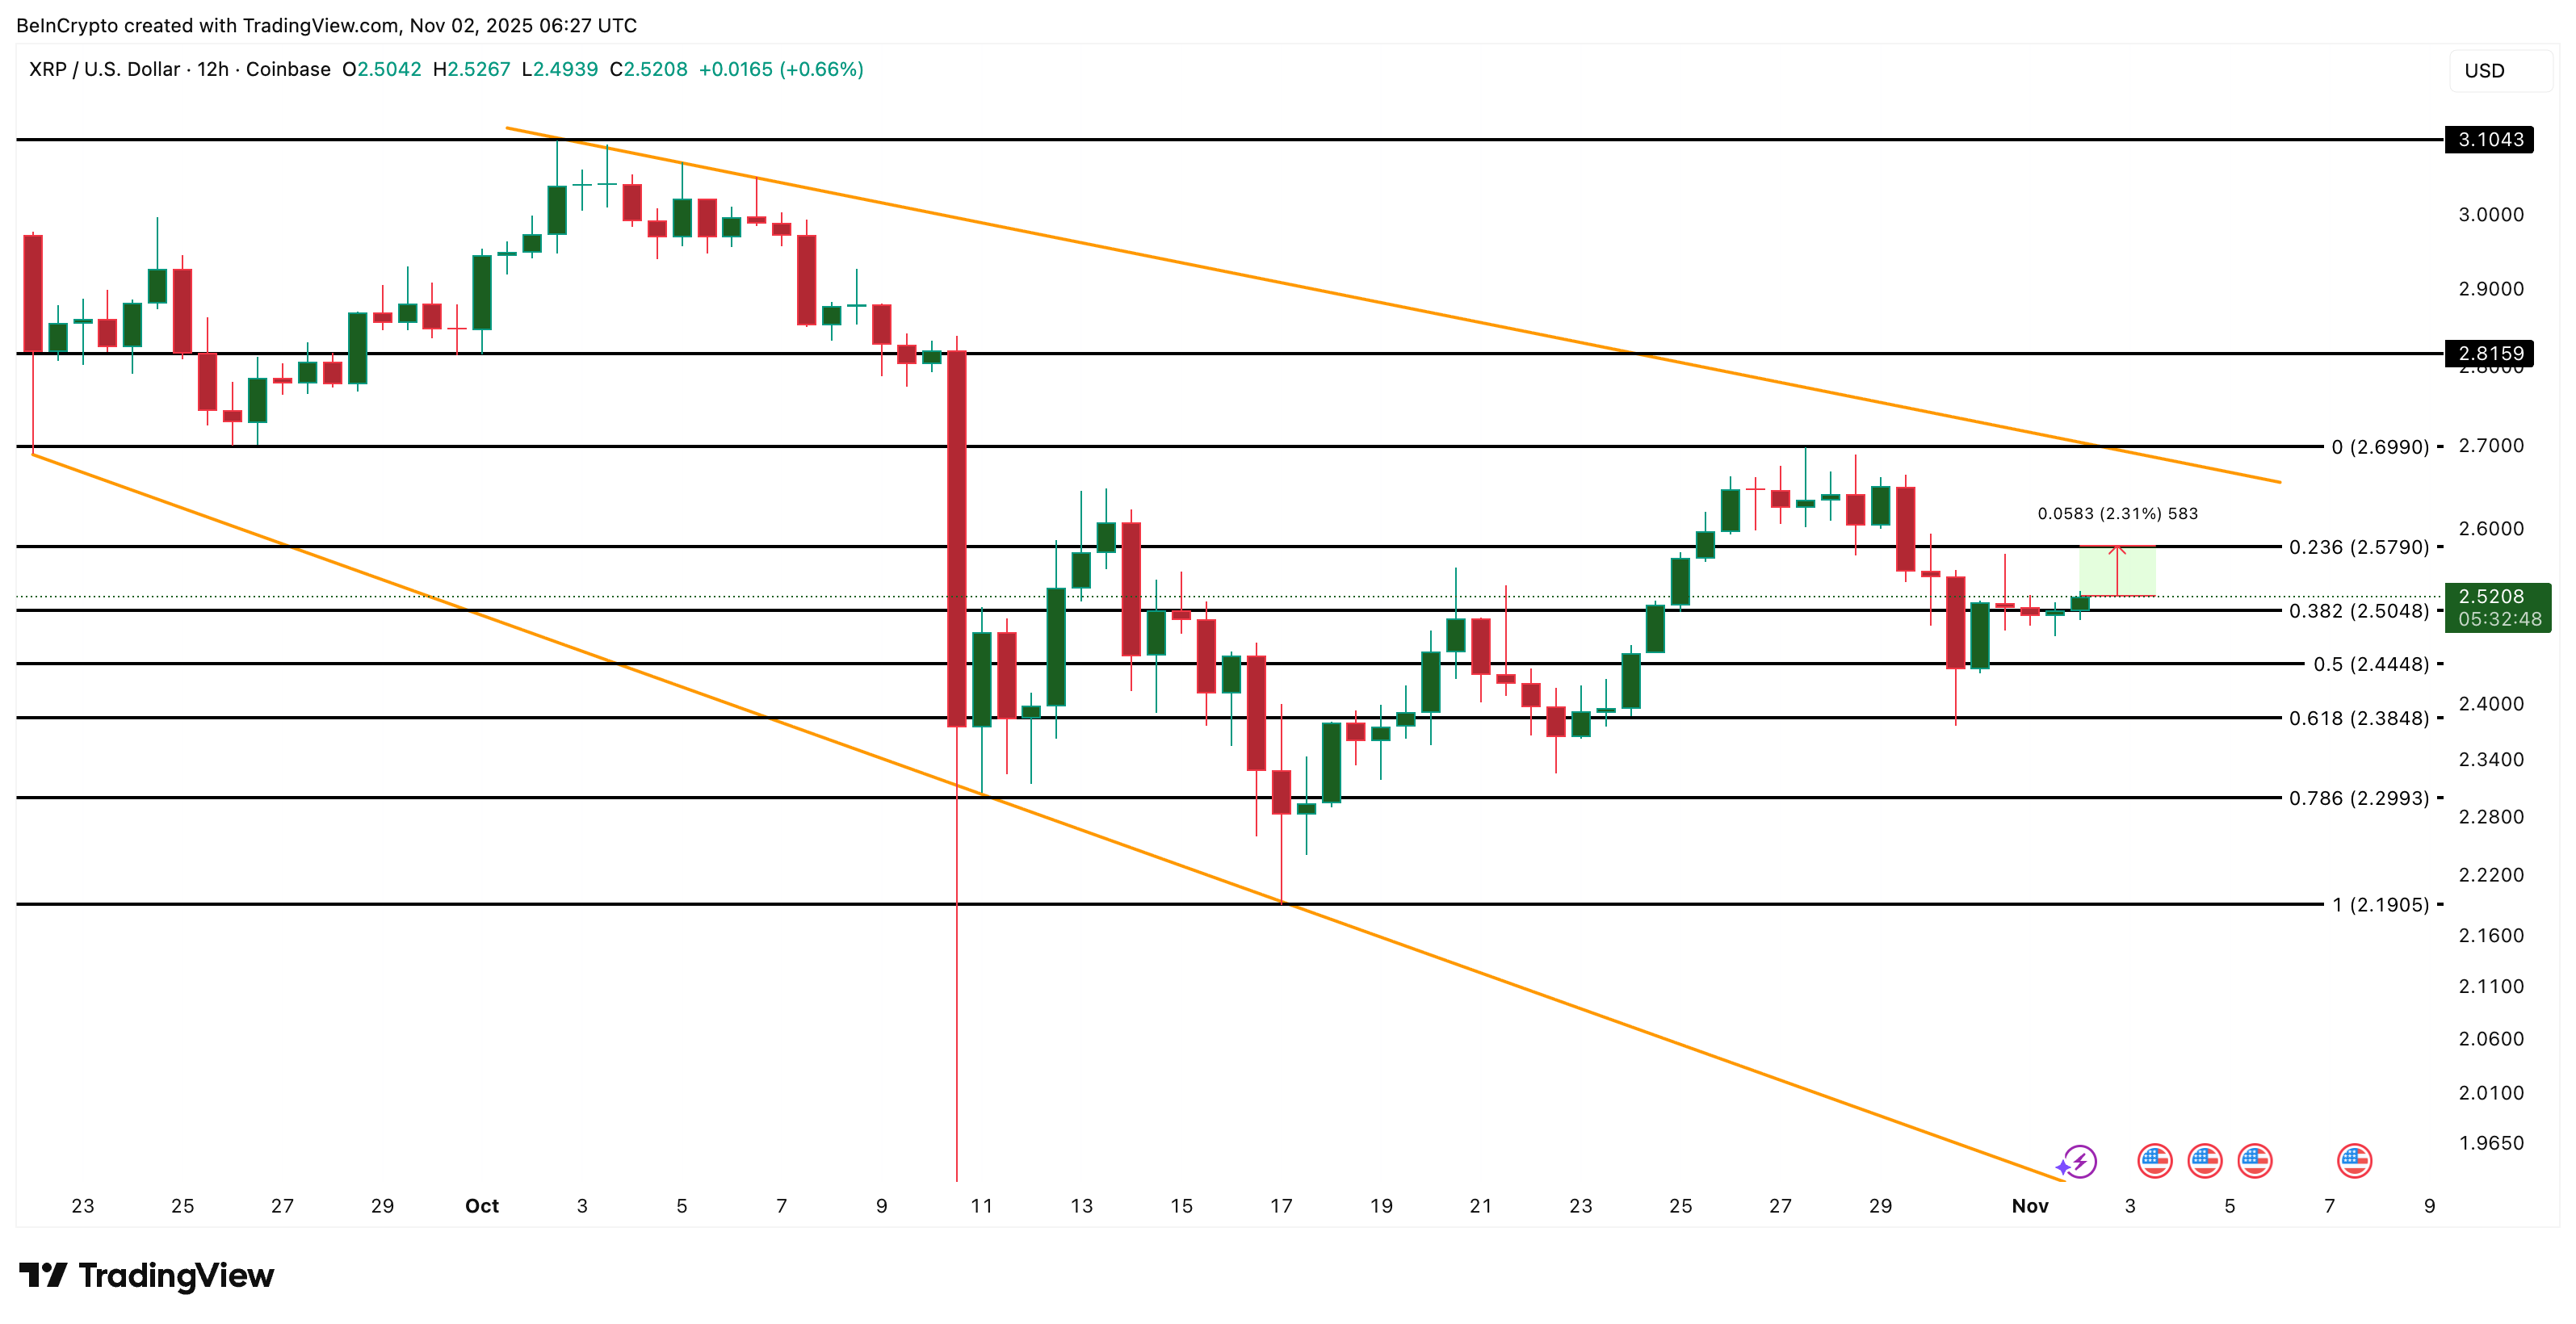
The technical chart adds to this narrative. On the 12-hour chart, XRP is forming a falling wedge — a pattern that usually signals a potential shift from decline to recovery. Prices are now testing the 0.382 Fibonacci retracement level at $2.50, almost touching the cost-basis zone noted earlier.
A daily close above $2.57 — roughly 2% higher than current levels — would confirm that buyers have cleared the near-term supply (between 2.52 and $2.54). The next key hurdle lies at $2.69, where the upper trendline of the wedge is located.
 XRP Price Analysis: TradingView
If the XRP price manages to stay above $2.69, it could open the door to $2.81, a higher cluster-zone marked on the heatmap. Sustained momentum beyond that may extend gains toward $3.10.
However, the XRP price setup has clear invalidation levels. A drop below $2.38, which is the 0.618 Fibonacci level, would weaken the bullish structure. Falling under $2.19 would further invalidate the bullishness, signaling that sellers have regained control.
The post XRP Inches Closer to Its Glory Zone — Only 2% Stands in the Way appeared first on BeInCrypto.


 24h Most Popular


 Utilities