XRP ($2.02) has struggled to create any upside traction over the past few days, with the price rejecting above $2.15 in the middle of the week and now back to lingering just above the $2 level.
A new long-term technical comparison shared by crypto analyst ChartNerd places XRP’s price behavior since its July all-time high of $3.65 into an interesting context, implying that what XRP is doing now resembles a phase from its 2016 market cycle that points to an incoming huge rally.
Repeating 2016 Rejection And ABC Crash Structure
According to crypto analyst ChartNerd, XRP’s current structure matches a similar price action that unfolded in late 2016. when price rejected an accumulation supply block and rolled into an ABC corrective move. That correction ultimately produced a 69% flash-wick decline that extended into the first quarter of 2017.
The drop was severe and unfolded over several months, eventually pushing XRP to as low as $0.00240, but it eventually represented the end of the correction rather than the end of the bullish cycle.
The chart accompanying the analysis, which is shown below, highlights a similar rejection pattern forming now. This pattern is based on how the XRP price rejected at its most recent all-time high in July. Since then, the monthly price chart has been printing consecutive red candles, with monthly closes consistently below opens.
At the time of writing, XRP is about a 44% correction from this all-time high. This means a 69% correction is yet to play out in its entirety. Therefore, if history repeats, a full 69% ABC-style move from the all-time high would drag XRP back below $1 and as low as $0.8. This move is expected to play out into the first quarter of 2026.
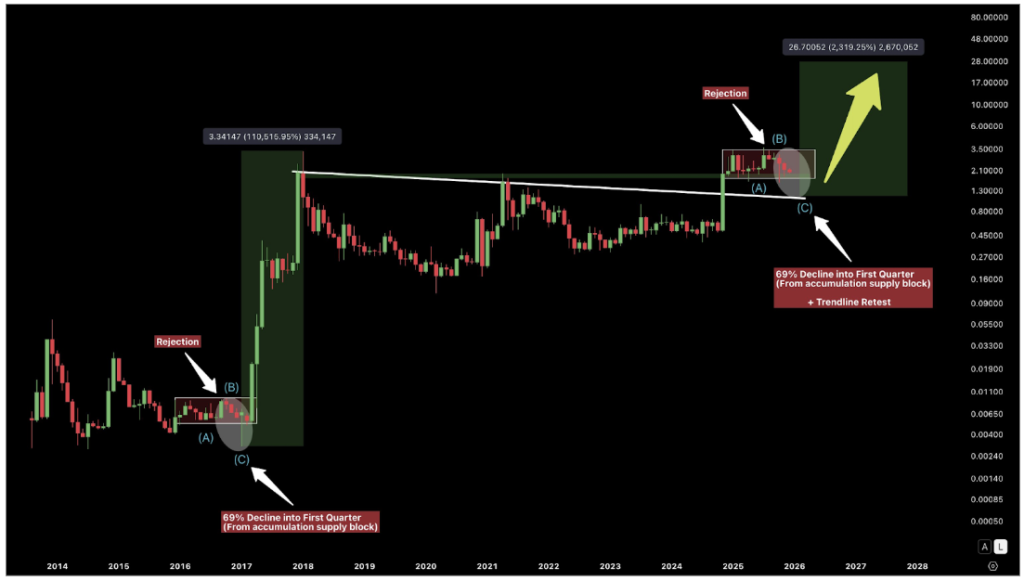
XRP Price Chart. Source: @ChartNerdTA
Potential Drop Could Be A Set-Up For A Much Larger Rally
XRP is currently trading at $2.04. Therefore, a deeper pullback below $1 will translate to a 51% decrease from the current price action. The idea of a deeper pullback from $2 is tough to imagine, especially given the inflows into Spot XRP ETFs. In fact, a pullback of that magnitude could test conviction across the market and cause many bullish traders to step aside.
However, the technical analysis frames it as a structural reset rather than anything else. In 2017, the post-crash consolidation laid the groundwork for one of XRP’s most explosive rallies on record, ultimately delivering gains in excess of 110,000%.
If this sequence plays out as expected, then the real bullish opportunity would develop later in 2026. From that reset zone, the chart projects a long-term advance to the 1.618 Fibonacci extension, placing a potential upside target around $27. The visual projection in the chart above shows a clean multi-month expansion zone that delivers a 2,300% gain after the corrective phase.
Featured image from Unsplash, chart from TradingView


 24h Most Popular


 Utilities