
XRP ($2.24) price has fallen nearly 24.5% over the past month, sliding to a low of $2.06 after breaking down from a head and shoulders pattern. The correction met its target, signaling that the bearish phase may have run its course.
Now, with buyers quietly returning and $2.06 acting as a strong base, XRP stands at a turning point — where early rebound signs meet rising technical risks.
Head and Shoulders Breakdown Complete, Buyers Build a Base at $2.06
XRP’s 12-hour chart confirms a clean breakdown from a head and shoulders pattern, a common bearish setup in which three peaks form before the price reverses.
The neckline break on November 3 sent XRP down to $2.06, almost perfectly hitting its projected target of $2.09.
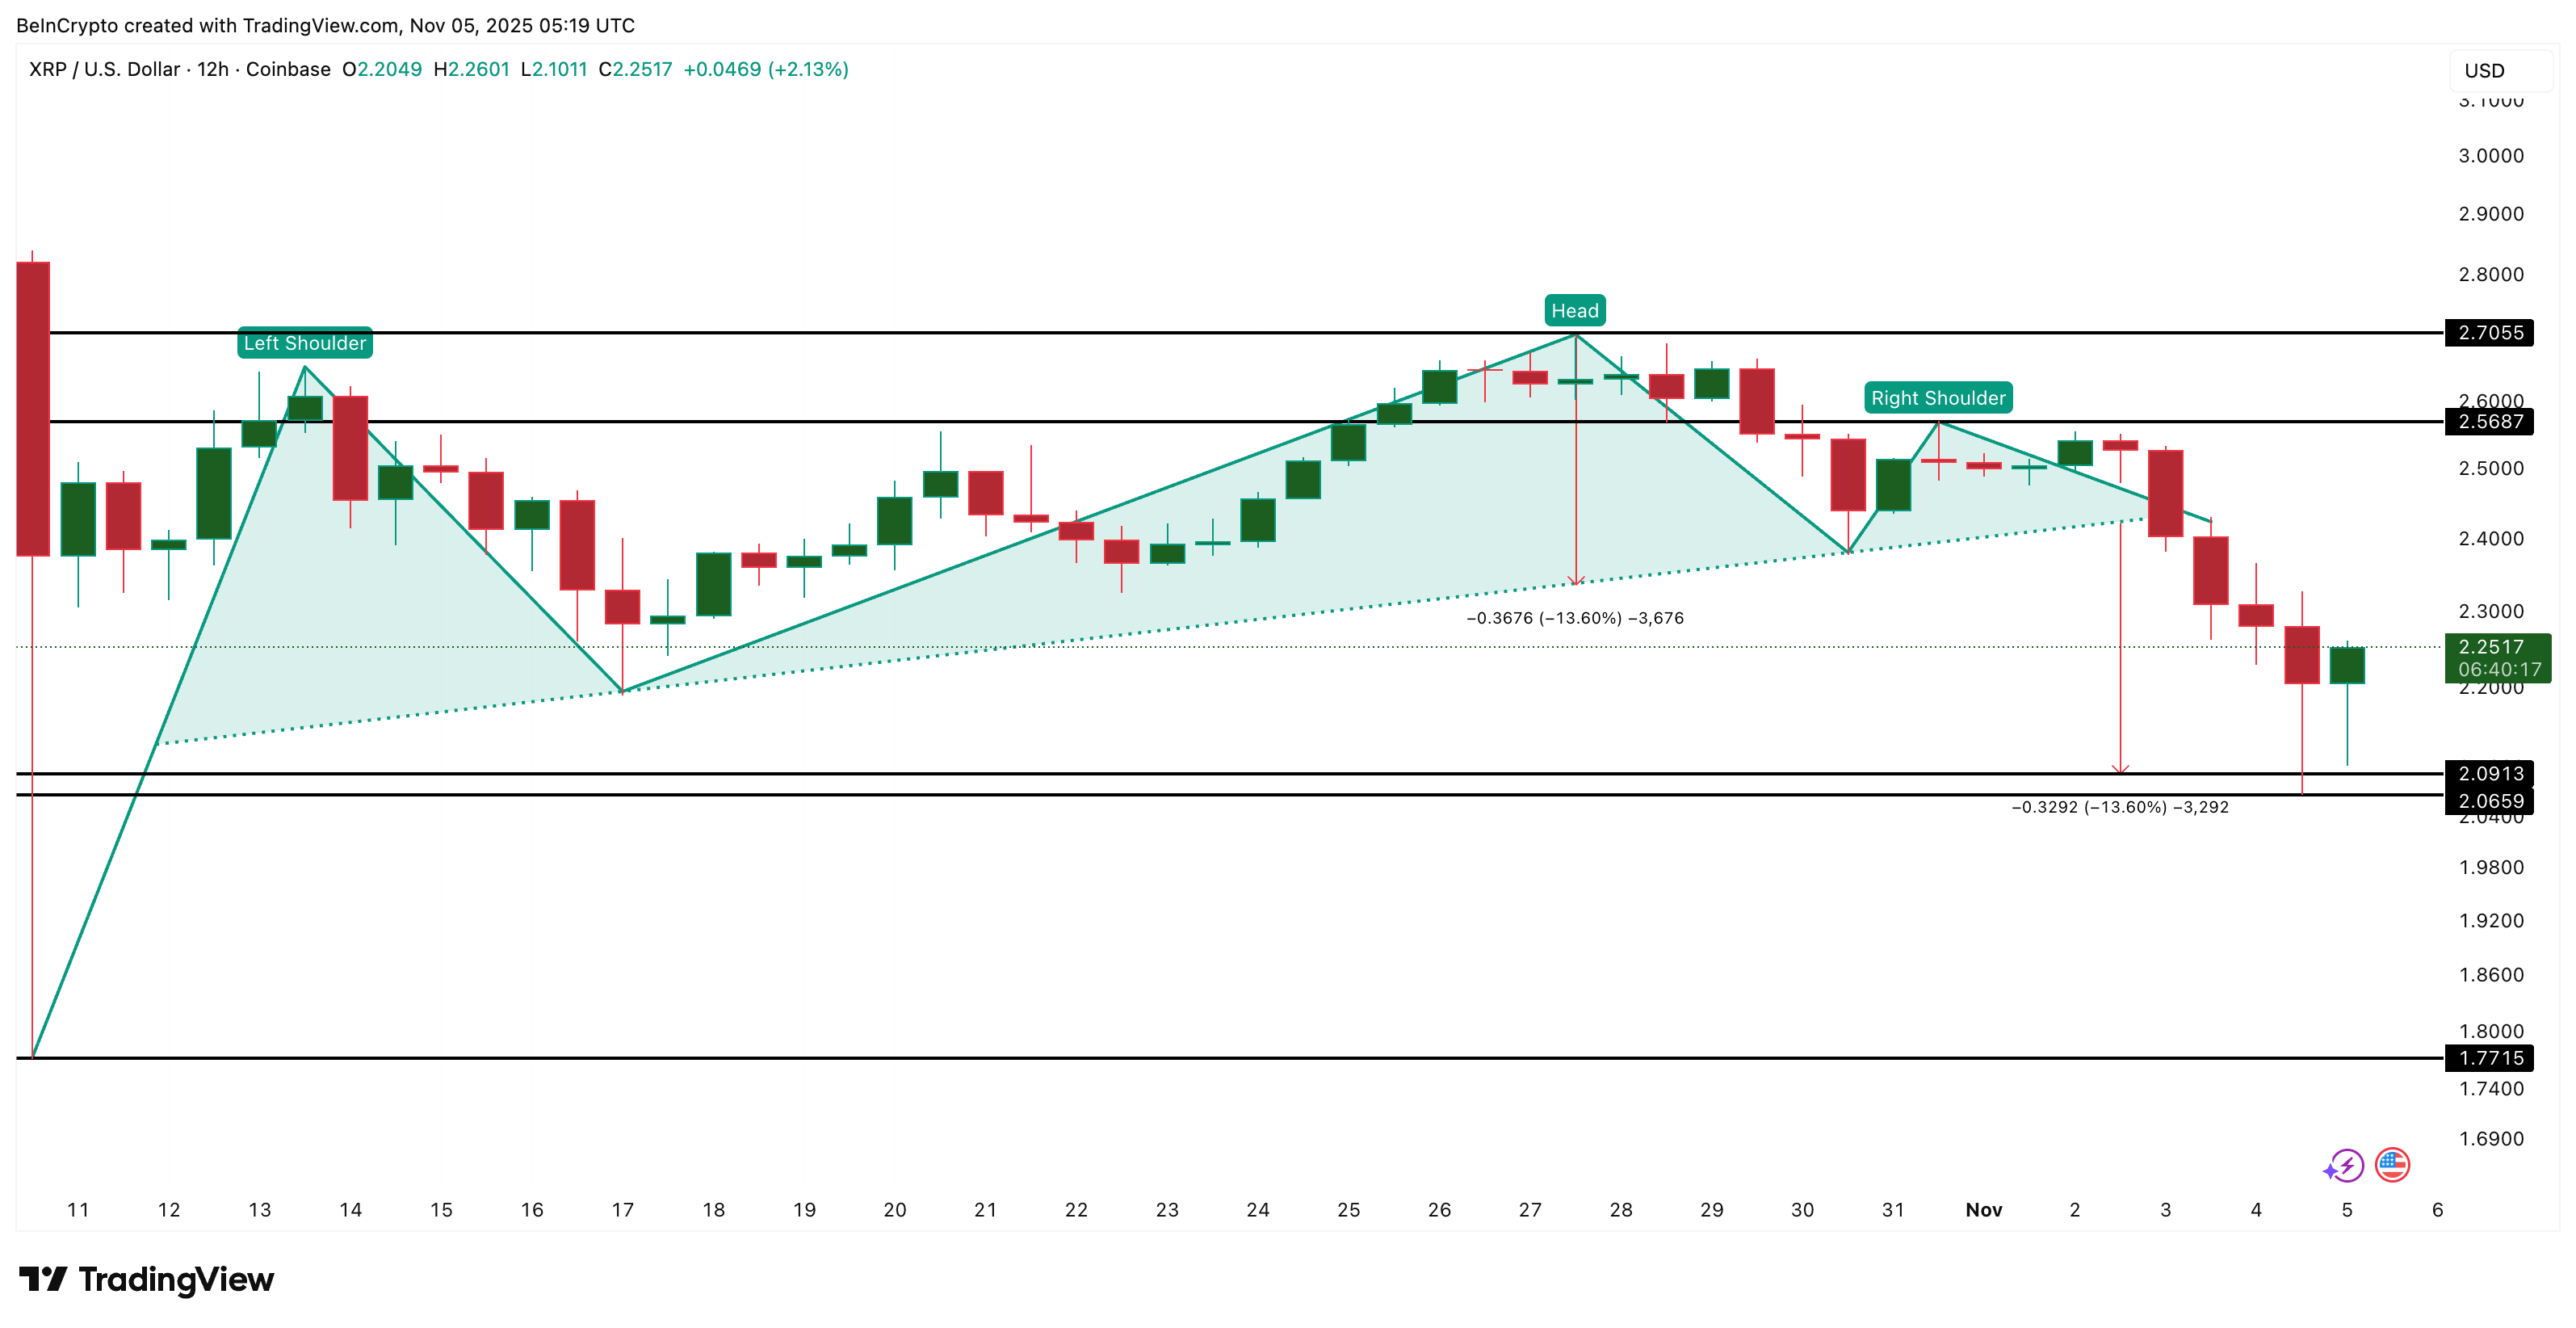 XRP Price Correction Seems Over: TradingView
Want more token insights like this? Sign up for Editor Harsh Notariya’s Daily Crypto Newsletter here.
That completion often marks the end of a short-term correction. And data now supports that buyers are stepping in.
According to Glassnode, XRP’s exchange net position change, which tracks whether investors are moving tokens in or out of exchanges, has turned sharply negative since October 30, showing that more XRP is being withdrawn from exchanges.
Withdrawals usually mean accumulation, not selling. The outflows jumped from 866 million XRP on October 30 to 1.25 billion XRP on November 4 (market correction date), a nearly 50% increase in just a few days. That shows larger holders might be using the post-drop zone to build positions.
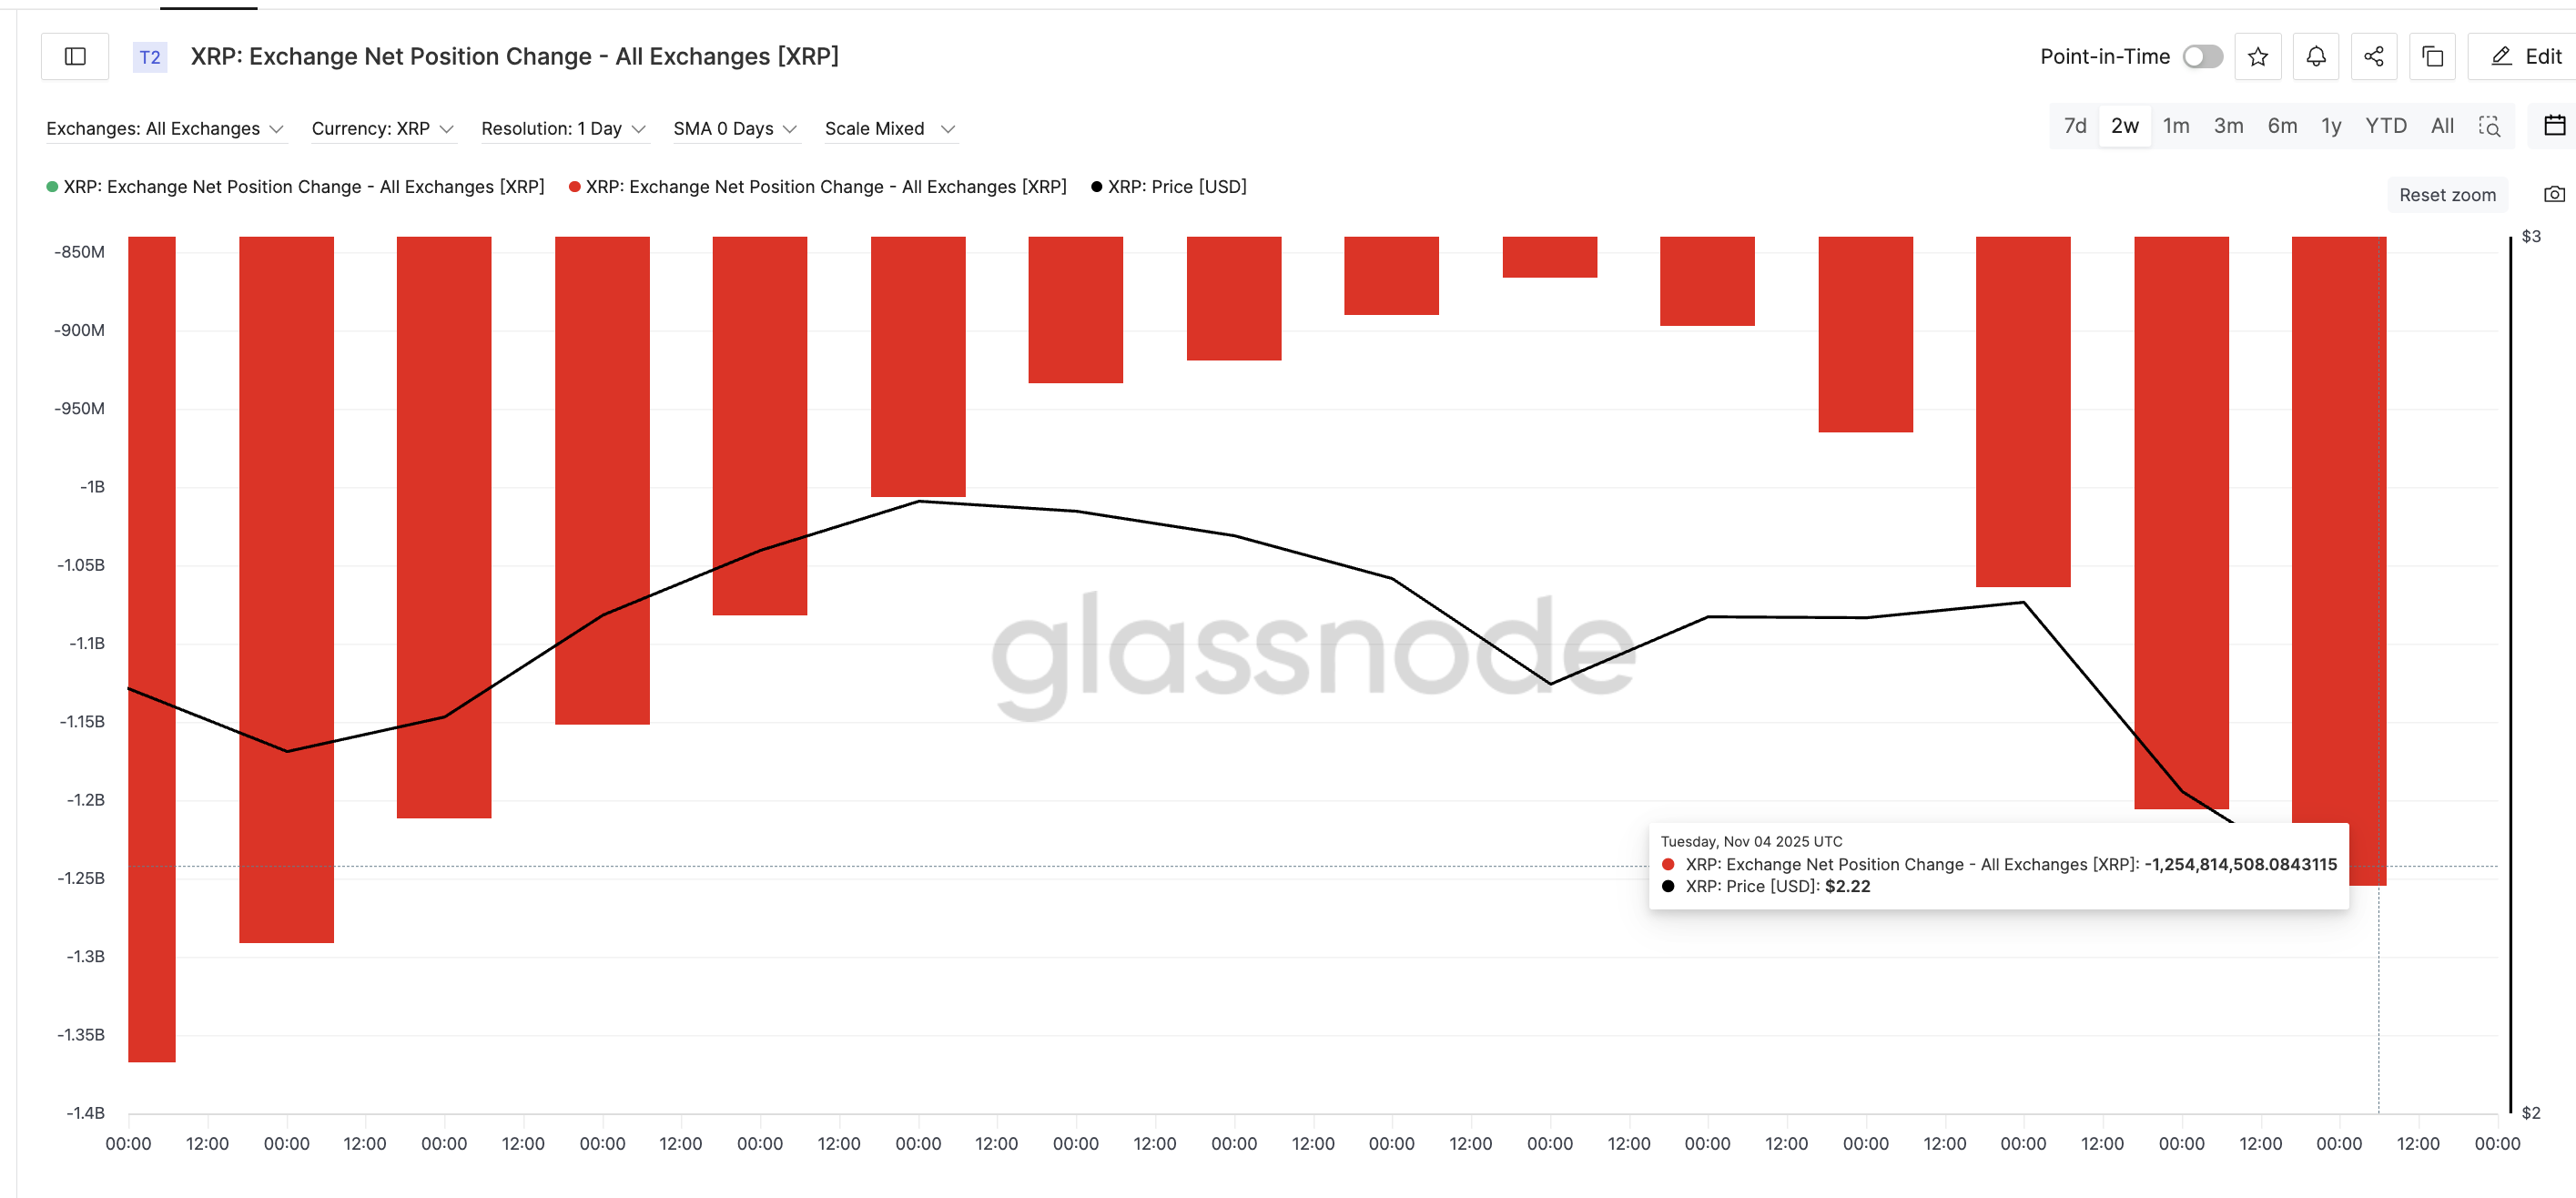 Spot Buyers Continue To Show Up: Glassnode
This combination, a completed bearish pattern and renewed outflows, gives XRP a potential base around $2.06. It is a zone that traders will now watch closely as the battle between bulls and bears intensifies.
Derivatives Pressure and a Bearish Crossover Threaten the XRP Price Recovery
On the derivatives front, the XRP price still faces some bearish pressure. Data from Coinglass shows about $262 million in short leverage between $2.31 and $2.63, compared with only $33 million in long positions.
This leaves the door open for a short squeeze, but it also means traders are still betting against the rebound.
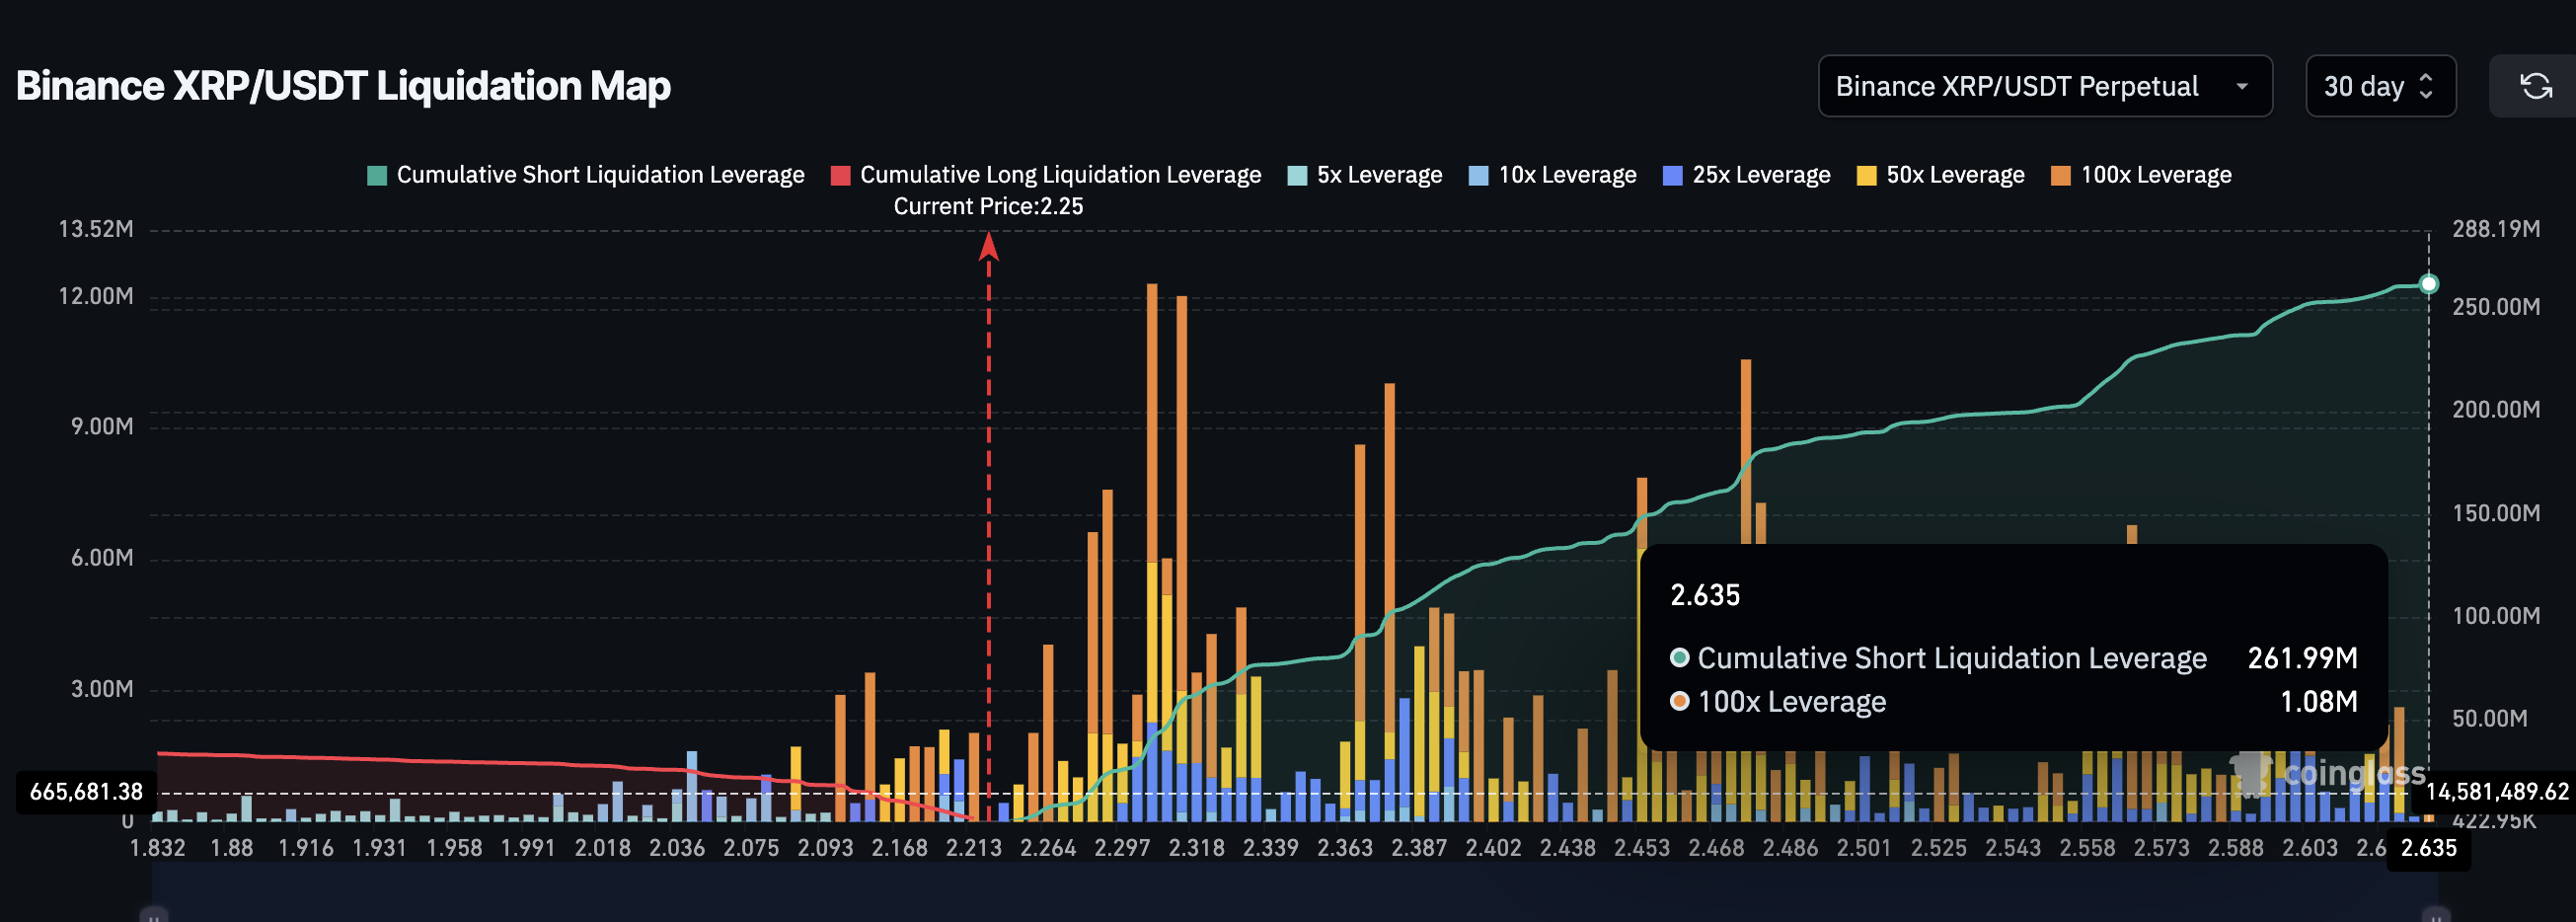 XRP Liquidation Map: Coinglass
Some aggressive long positions also remain vulnerable near $2.08, visible on the Binance liquidation map. If the XRP price dips slightly, these could be forced to close, adding temporary downside pressure before any squeeze can unfold.
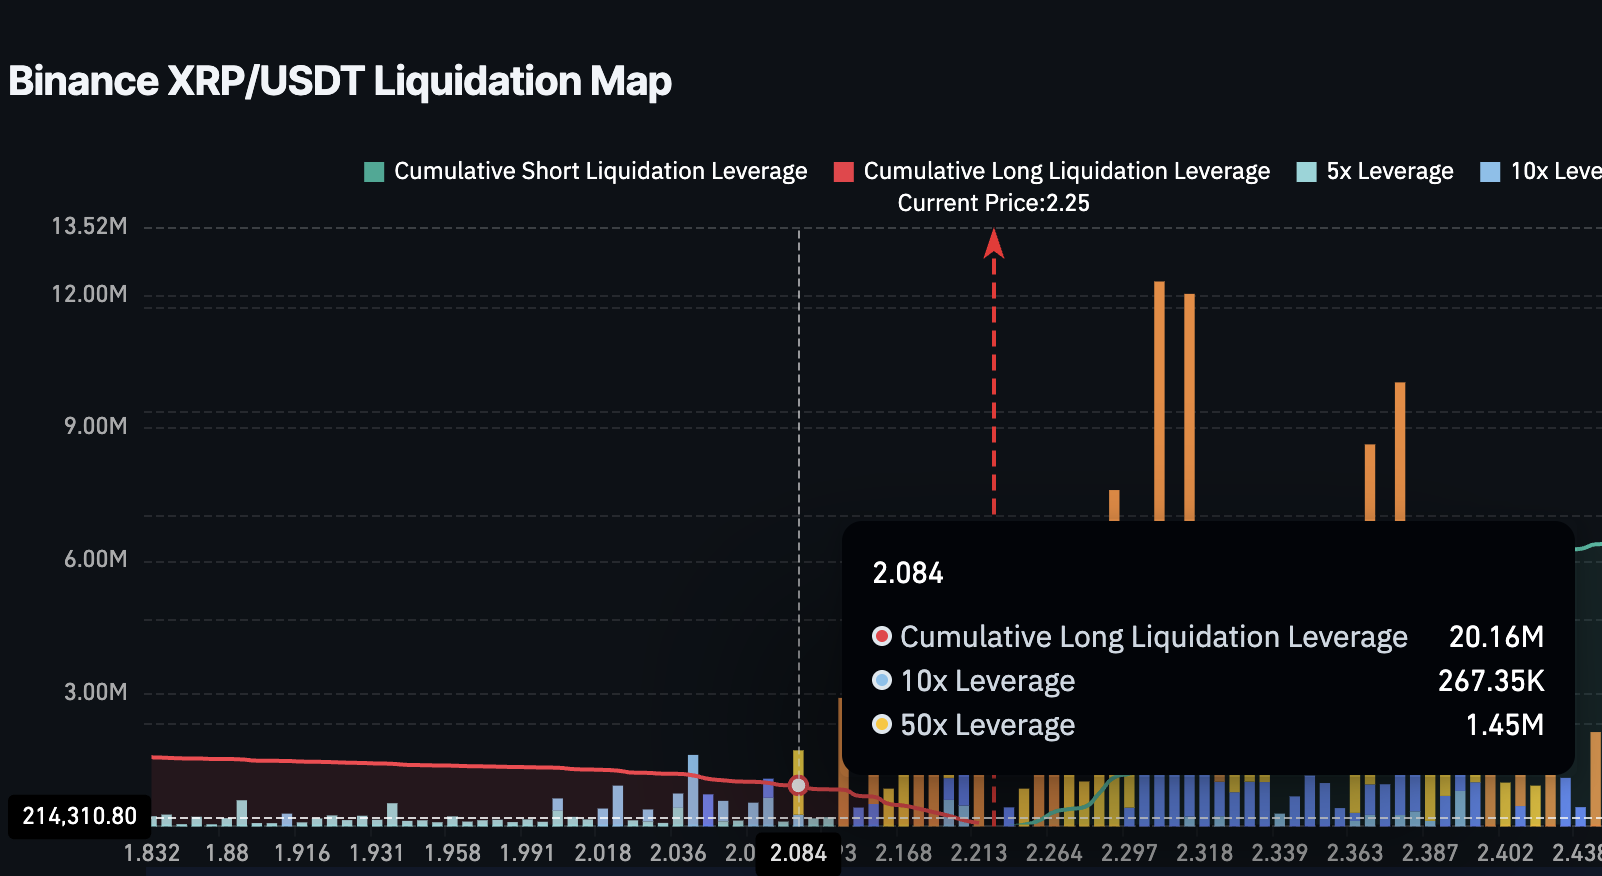 Residual Long Positions: Coinglass
Zooming out, the daily chart adds another layer of caution. The 50-day Exponential Moving Average (EMA), which smooths price trends, is closing in on the 200-day EMA. If the 50-day crosses below the 200-day, it forms a death cross, a bearish signal that often warns of extended weakness.
This pattern aligns with XRP’s falling wedge. It is a structure that usually precedes a bullish breakout but can still produce lower lows before turning up.
The wedge’s lower trendline only has two touchpoints, making it weaker support. If $2.06 breaks, XRP could retest $1.91 before a recovery attempt.
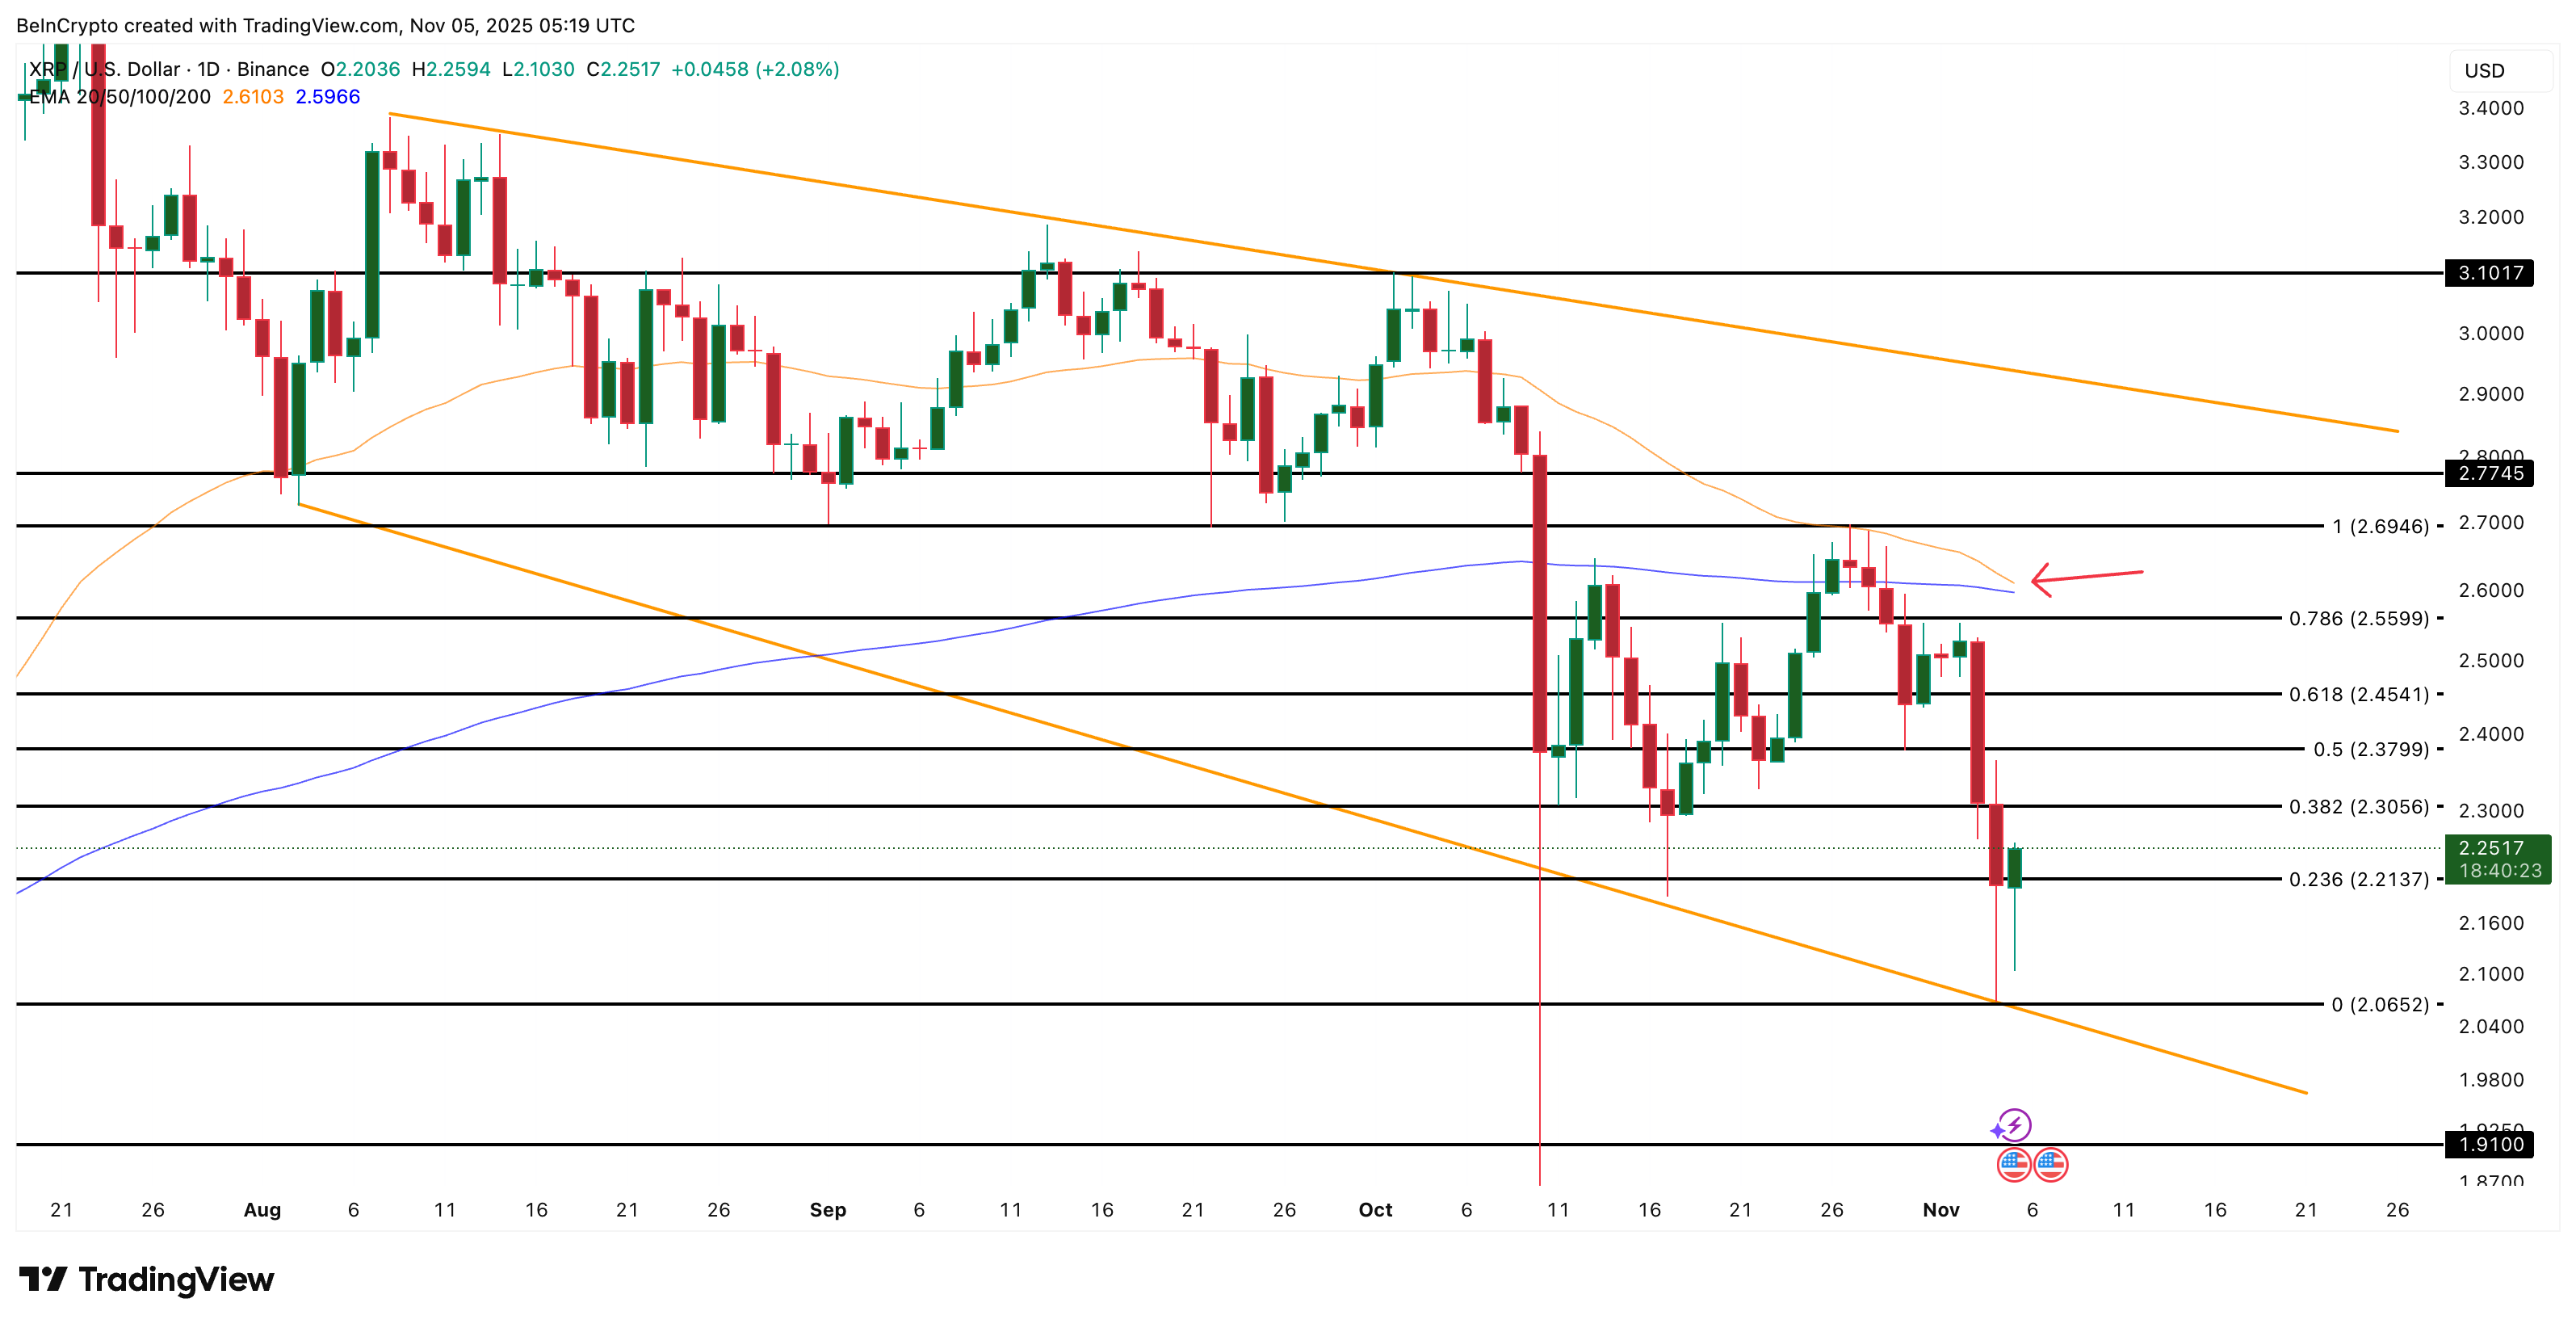 XRP Price Analysis: TradingView
Adding to the technical picture, analysts at B2BinPay shared a similar view, describing XRP’s current structure as consolidation within a broader uptrend rather than a full reversal:
“XRP is consolidating near the $2.25–$2.30 support area within a falling wedge that sits inside a larger ascending channel. The narrowing range and contracting volumes suggest volatility compression — typically a cooling phase before the next directional move. A decisive close above $2.55–$2.70 could end the correction and open a path toward $3.20–$3.40,” analysts added.
For buyers, the key test remains overhead, according to the price chart. A break above $2.45 and $2.55 would flip short-term sentiment bullish again. That could potentially set the stage for a move toward $2.77 and $3.10. The levels could go higher, per the analysts’ projections. But first, the consolidation and bearishness need to end.
The post XRP Price Braces for a “Death” Punch as Bulls and Bears Fight for Control at $2.06 appeared first on BeInCrypto.


 24h Most Popular


 Utilities