
The XRP ($2.27) price is down almost 9% this week, showing clear weakness after failing to hold its recent rebound. Sellers remain in control for now, but one support level continues to hold.
Whether this level survives decides if XRP forms a cycle bottom or slides into a deeper correction.
Weakness Shows Up In Momentum, But Support Still Holds
The first sign of pressure comes from momentum. Between October 13 and November 10, the XRP price made a lower high while the Relative Strength Index (RSI) made a higher high. RSI tracks buying pressure, and this pattern is called a hidden bearish divergence. It shows buying strength was rising, but not enough to push the price up.
That explains the week’s decline.
Want more token insights like this? Sign up for Editor Harsh Notariya’s Daily Crypto Newsletter here.
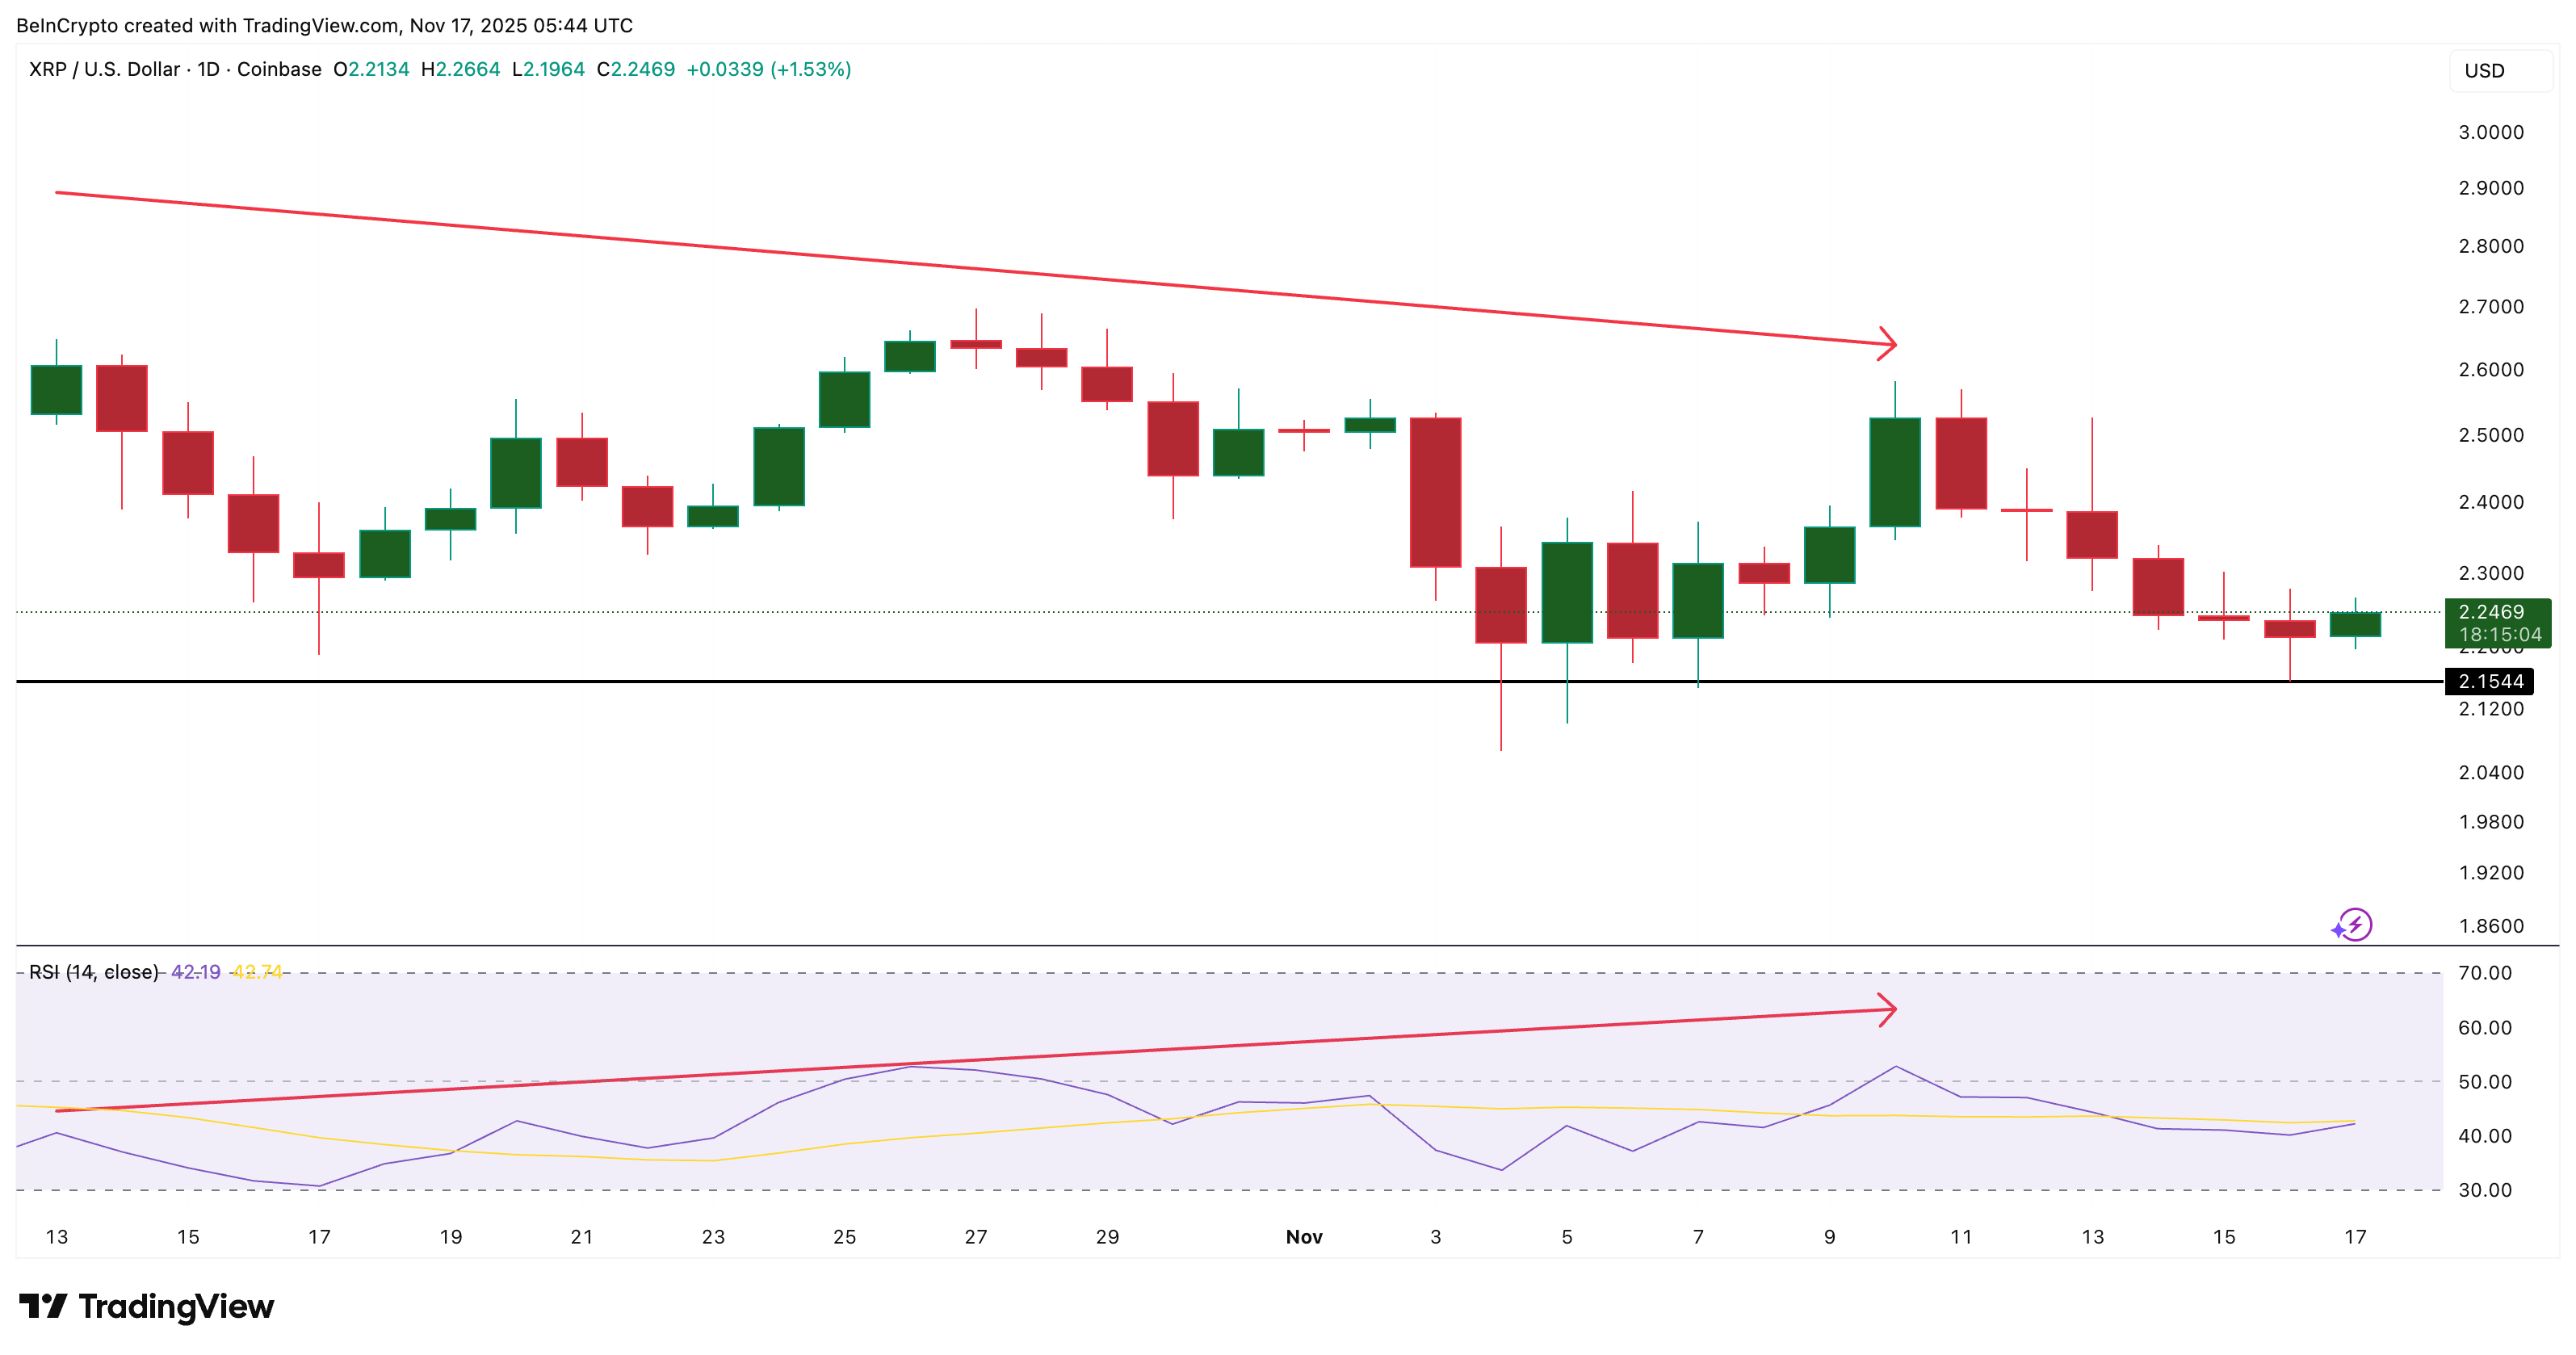 XRP Flashes Bearish Divergence: TradingView
Even with that weakness, the $2.154 zone still holds. This is not just a chart level. The cost-basis heatmap confirms it. Between $2.161 and $2.174, XRP has a huge supply cluster of 1.359 billion tokens.
That makes this band the strongest support in the near term. The $2.154 level on the chart sits immediately under this cluster and could be the only thing standing between a bounce and a breakdown.
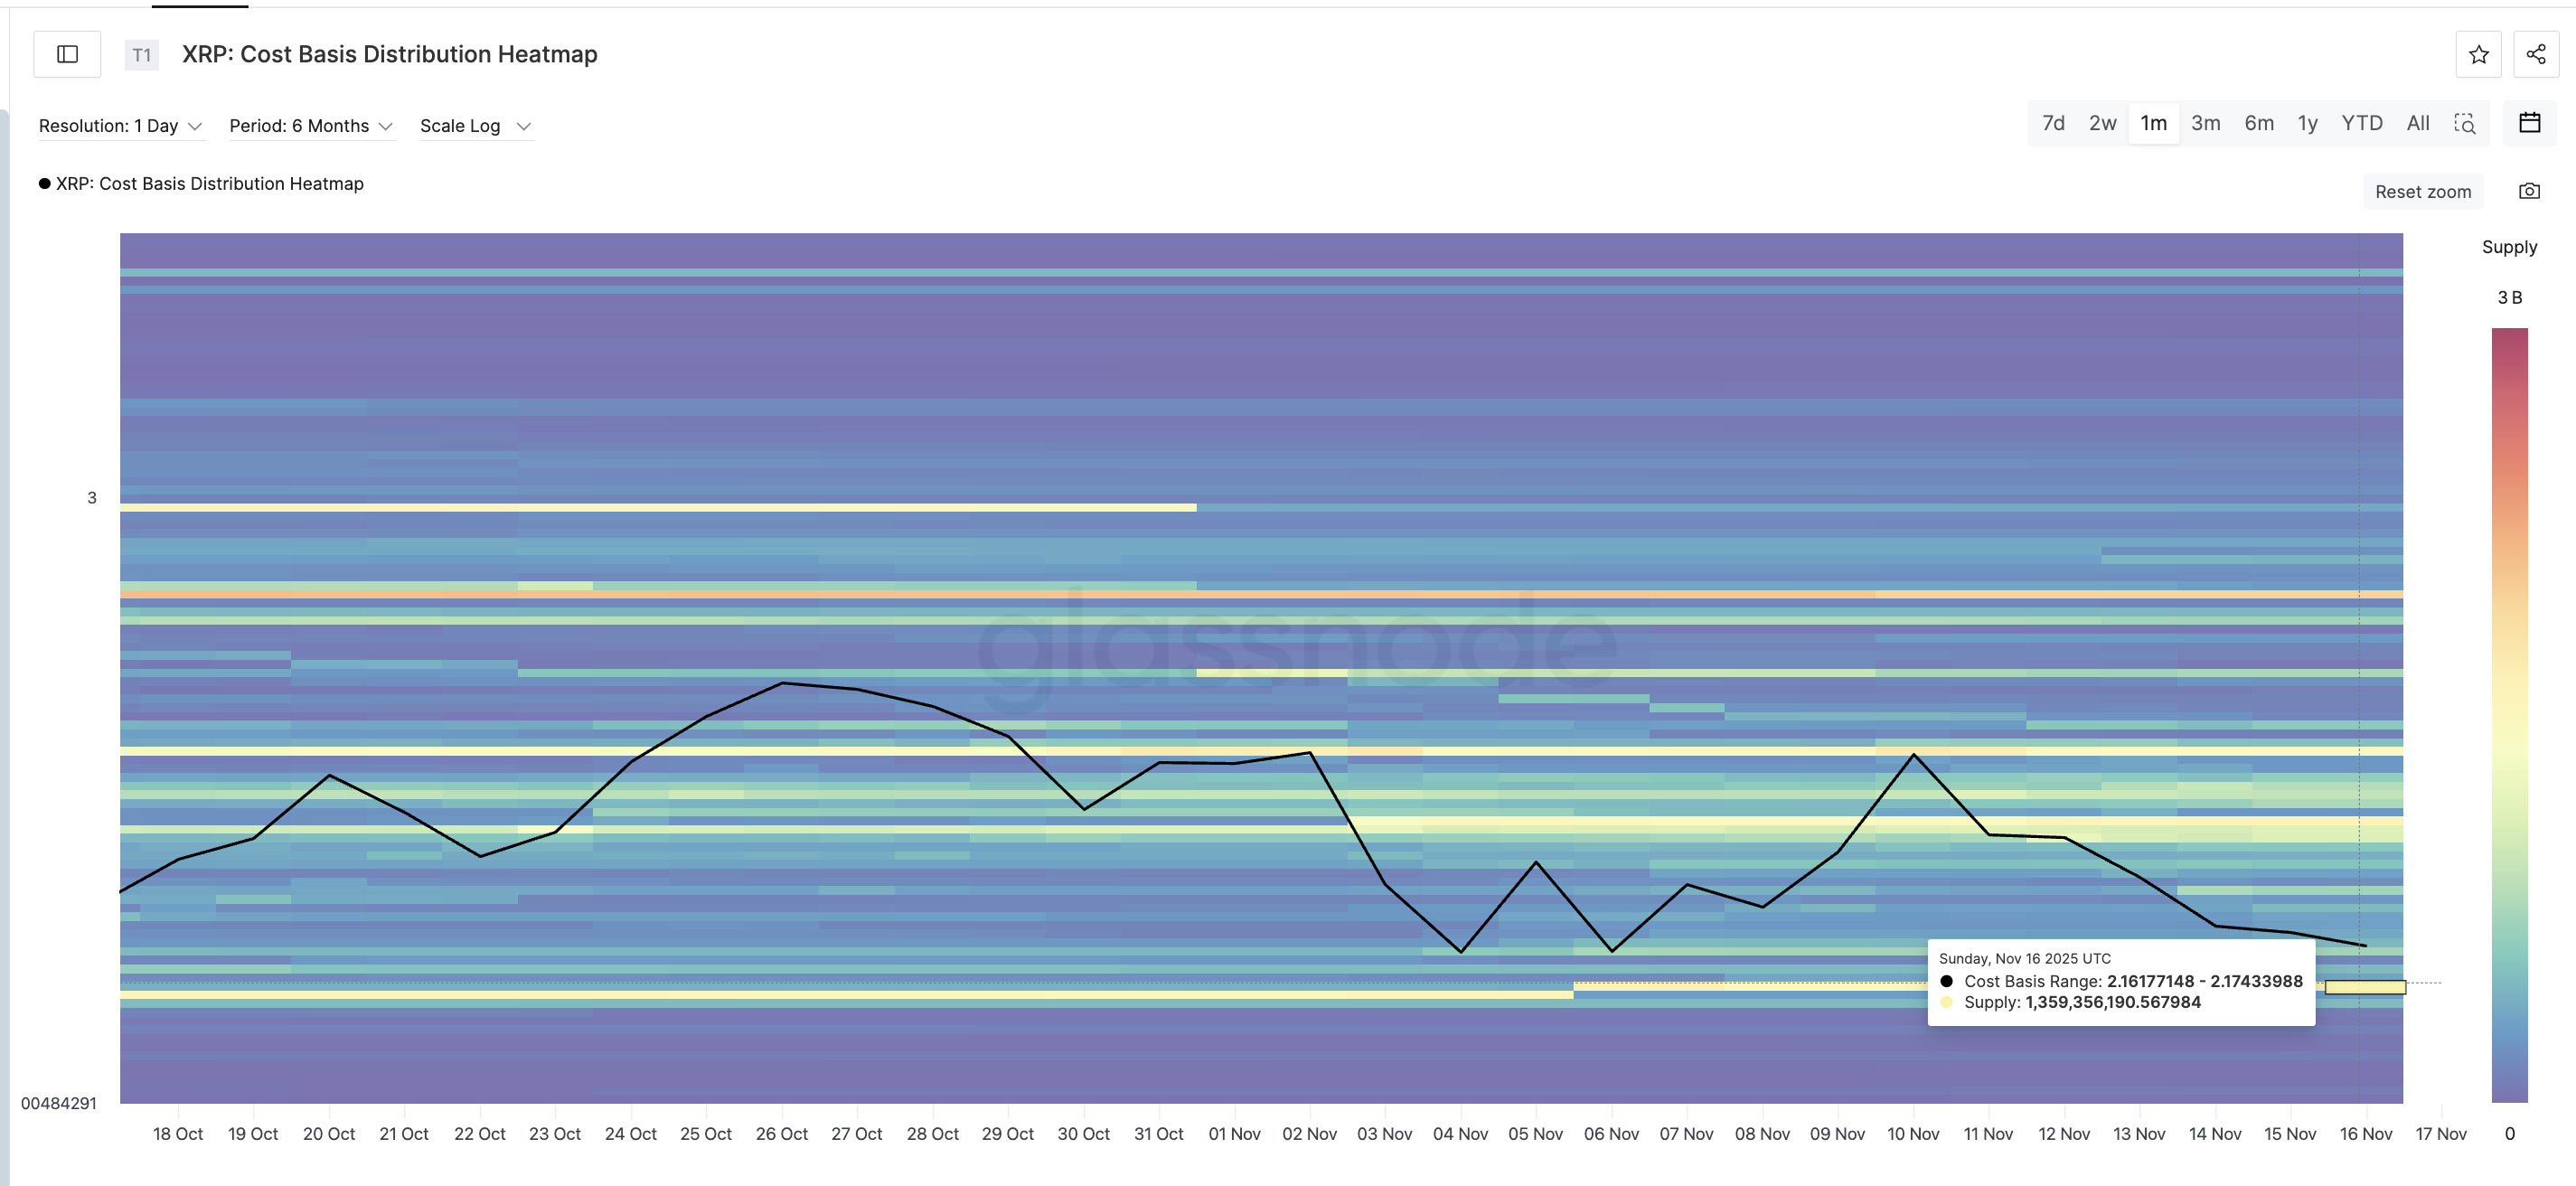 Support Cluster Could Limit Downside: Glassnode
If this band holds, the divergence can be considered “played out,” opening the door for a recovery attempt.
Sentiment Shows A Bottom May Be Forming
The second signal is psychological. XRP’s Net Unrealized Profit and Loss (NUPL) fell to 0.32 on November 16, its lowest reading in a year. NUPL measures investor sentiment—whether wallets hold paper profit or loss.
The last time NUPL hit a yearly low (0.43 on April 8), the XRP price rallied from $1.80 to $3.54 by July 22. That was a 96% rise.
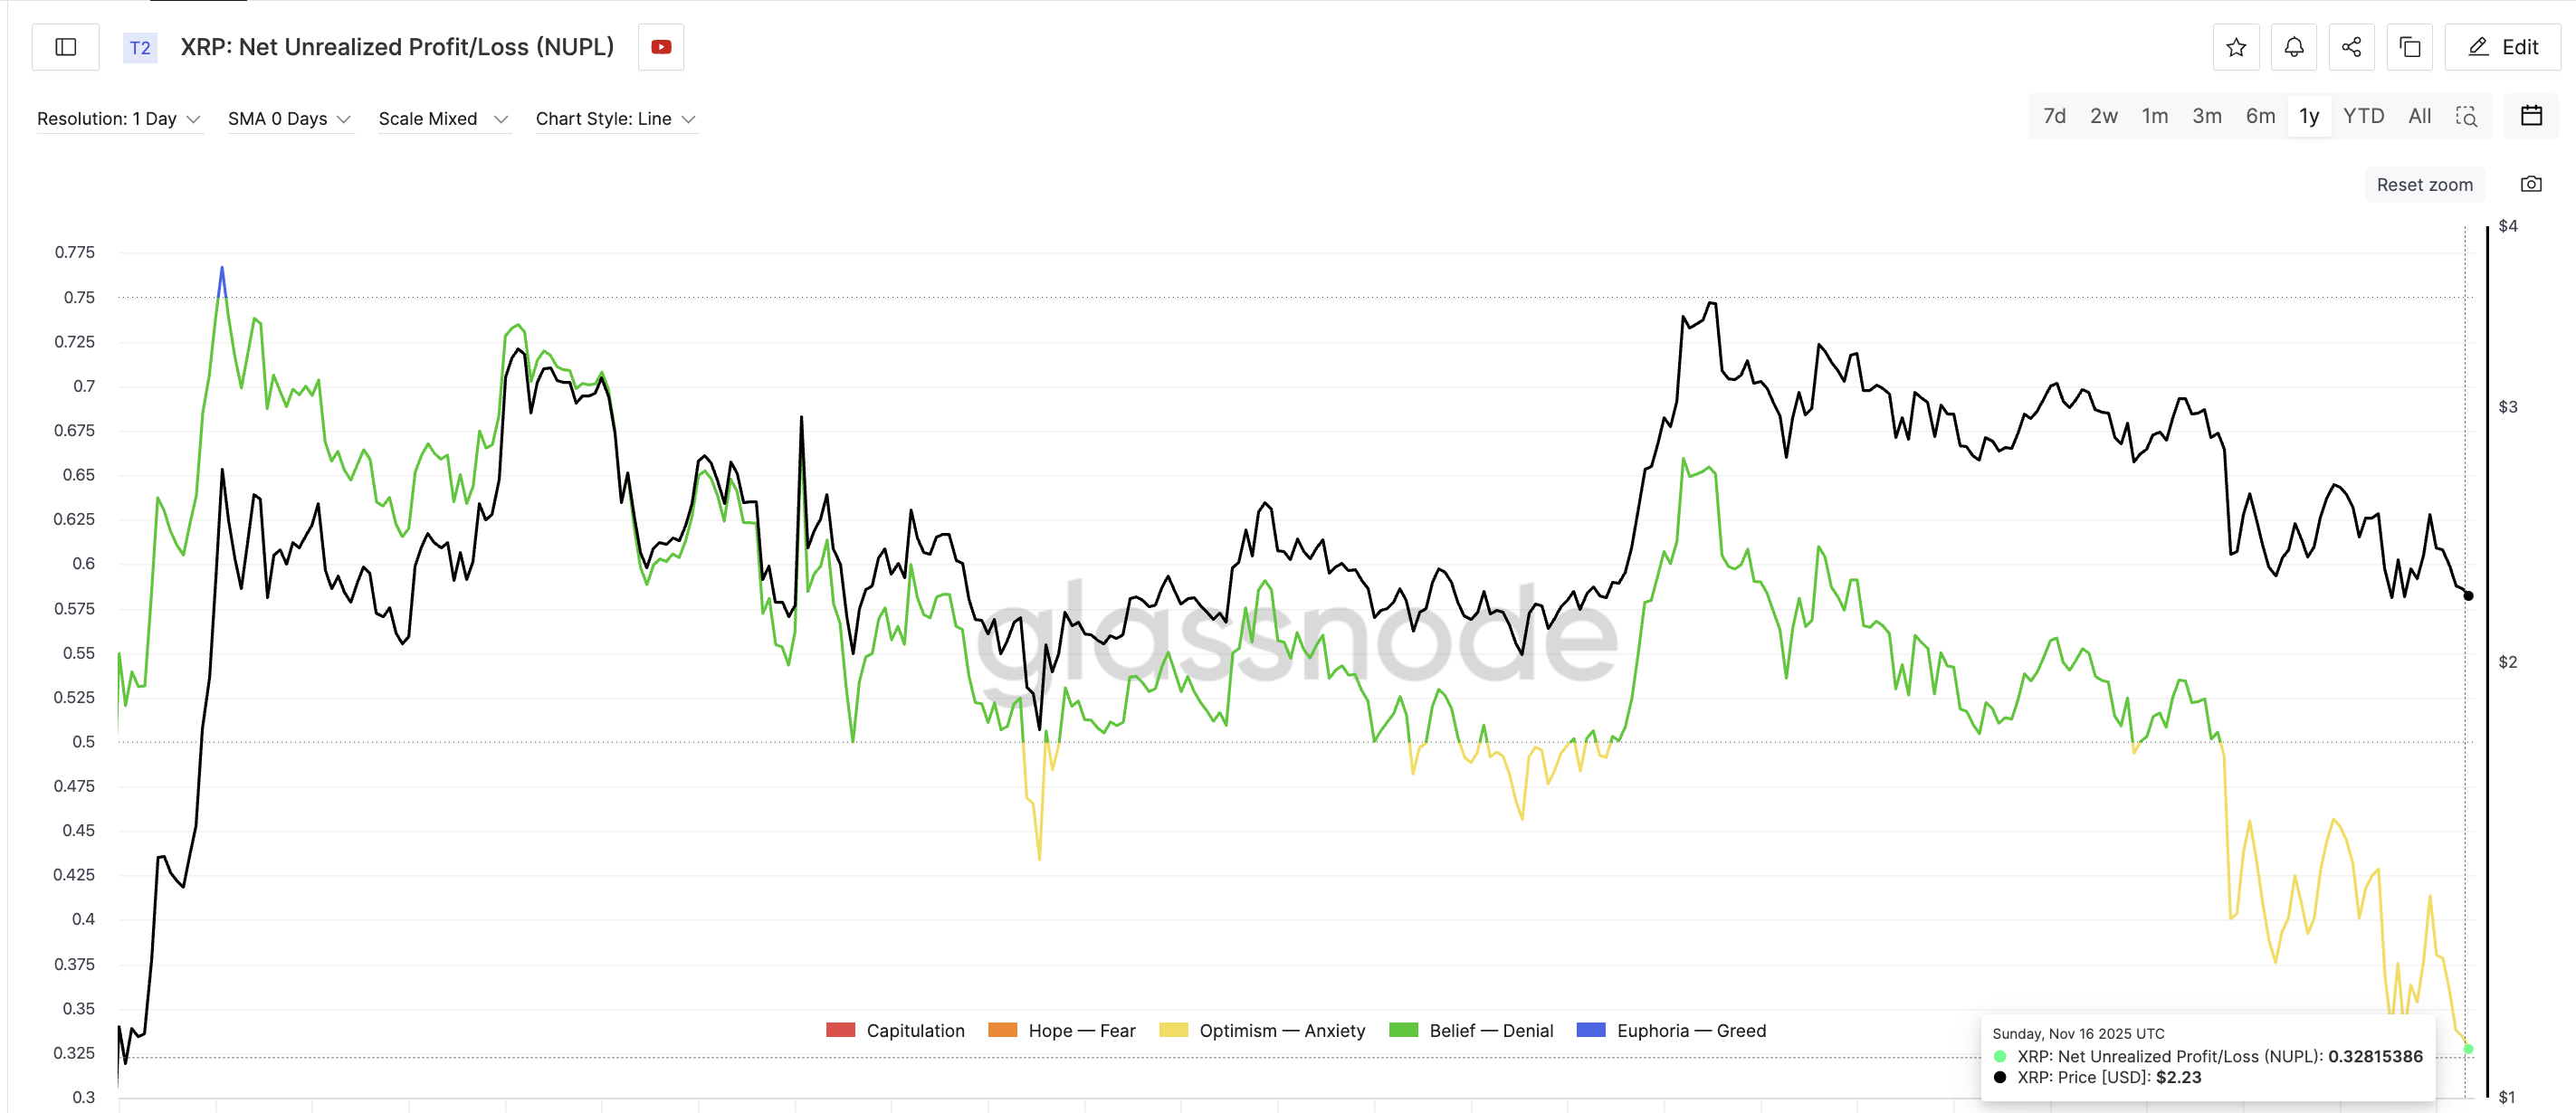 XRP Flashes A Bottoming Signal: Glassnode
This time, the NUPL is even lower, which means sentiment has reset more deeply. If the $2.154 support holds, the same type of bottoming behavior could form here, too.
XRP Price Levels To Watch Next
If the XRP price loses $2.154, the support zone breaks. In that case, there is little strong demand until $2.065, and falling under $2.06 opens a path toward even lower levels.
If buyers defend support instead, the first upside test sits at $2.394, a level with several prior rejections. A move above $2.394 starts a real rebound attempt.
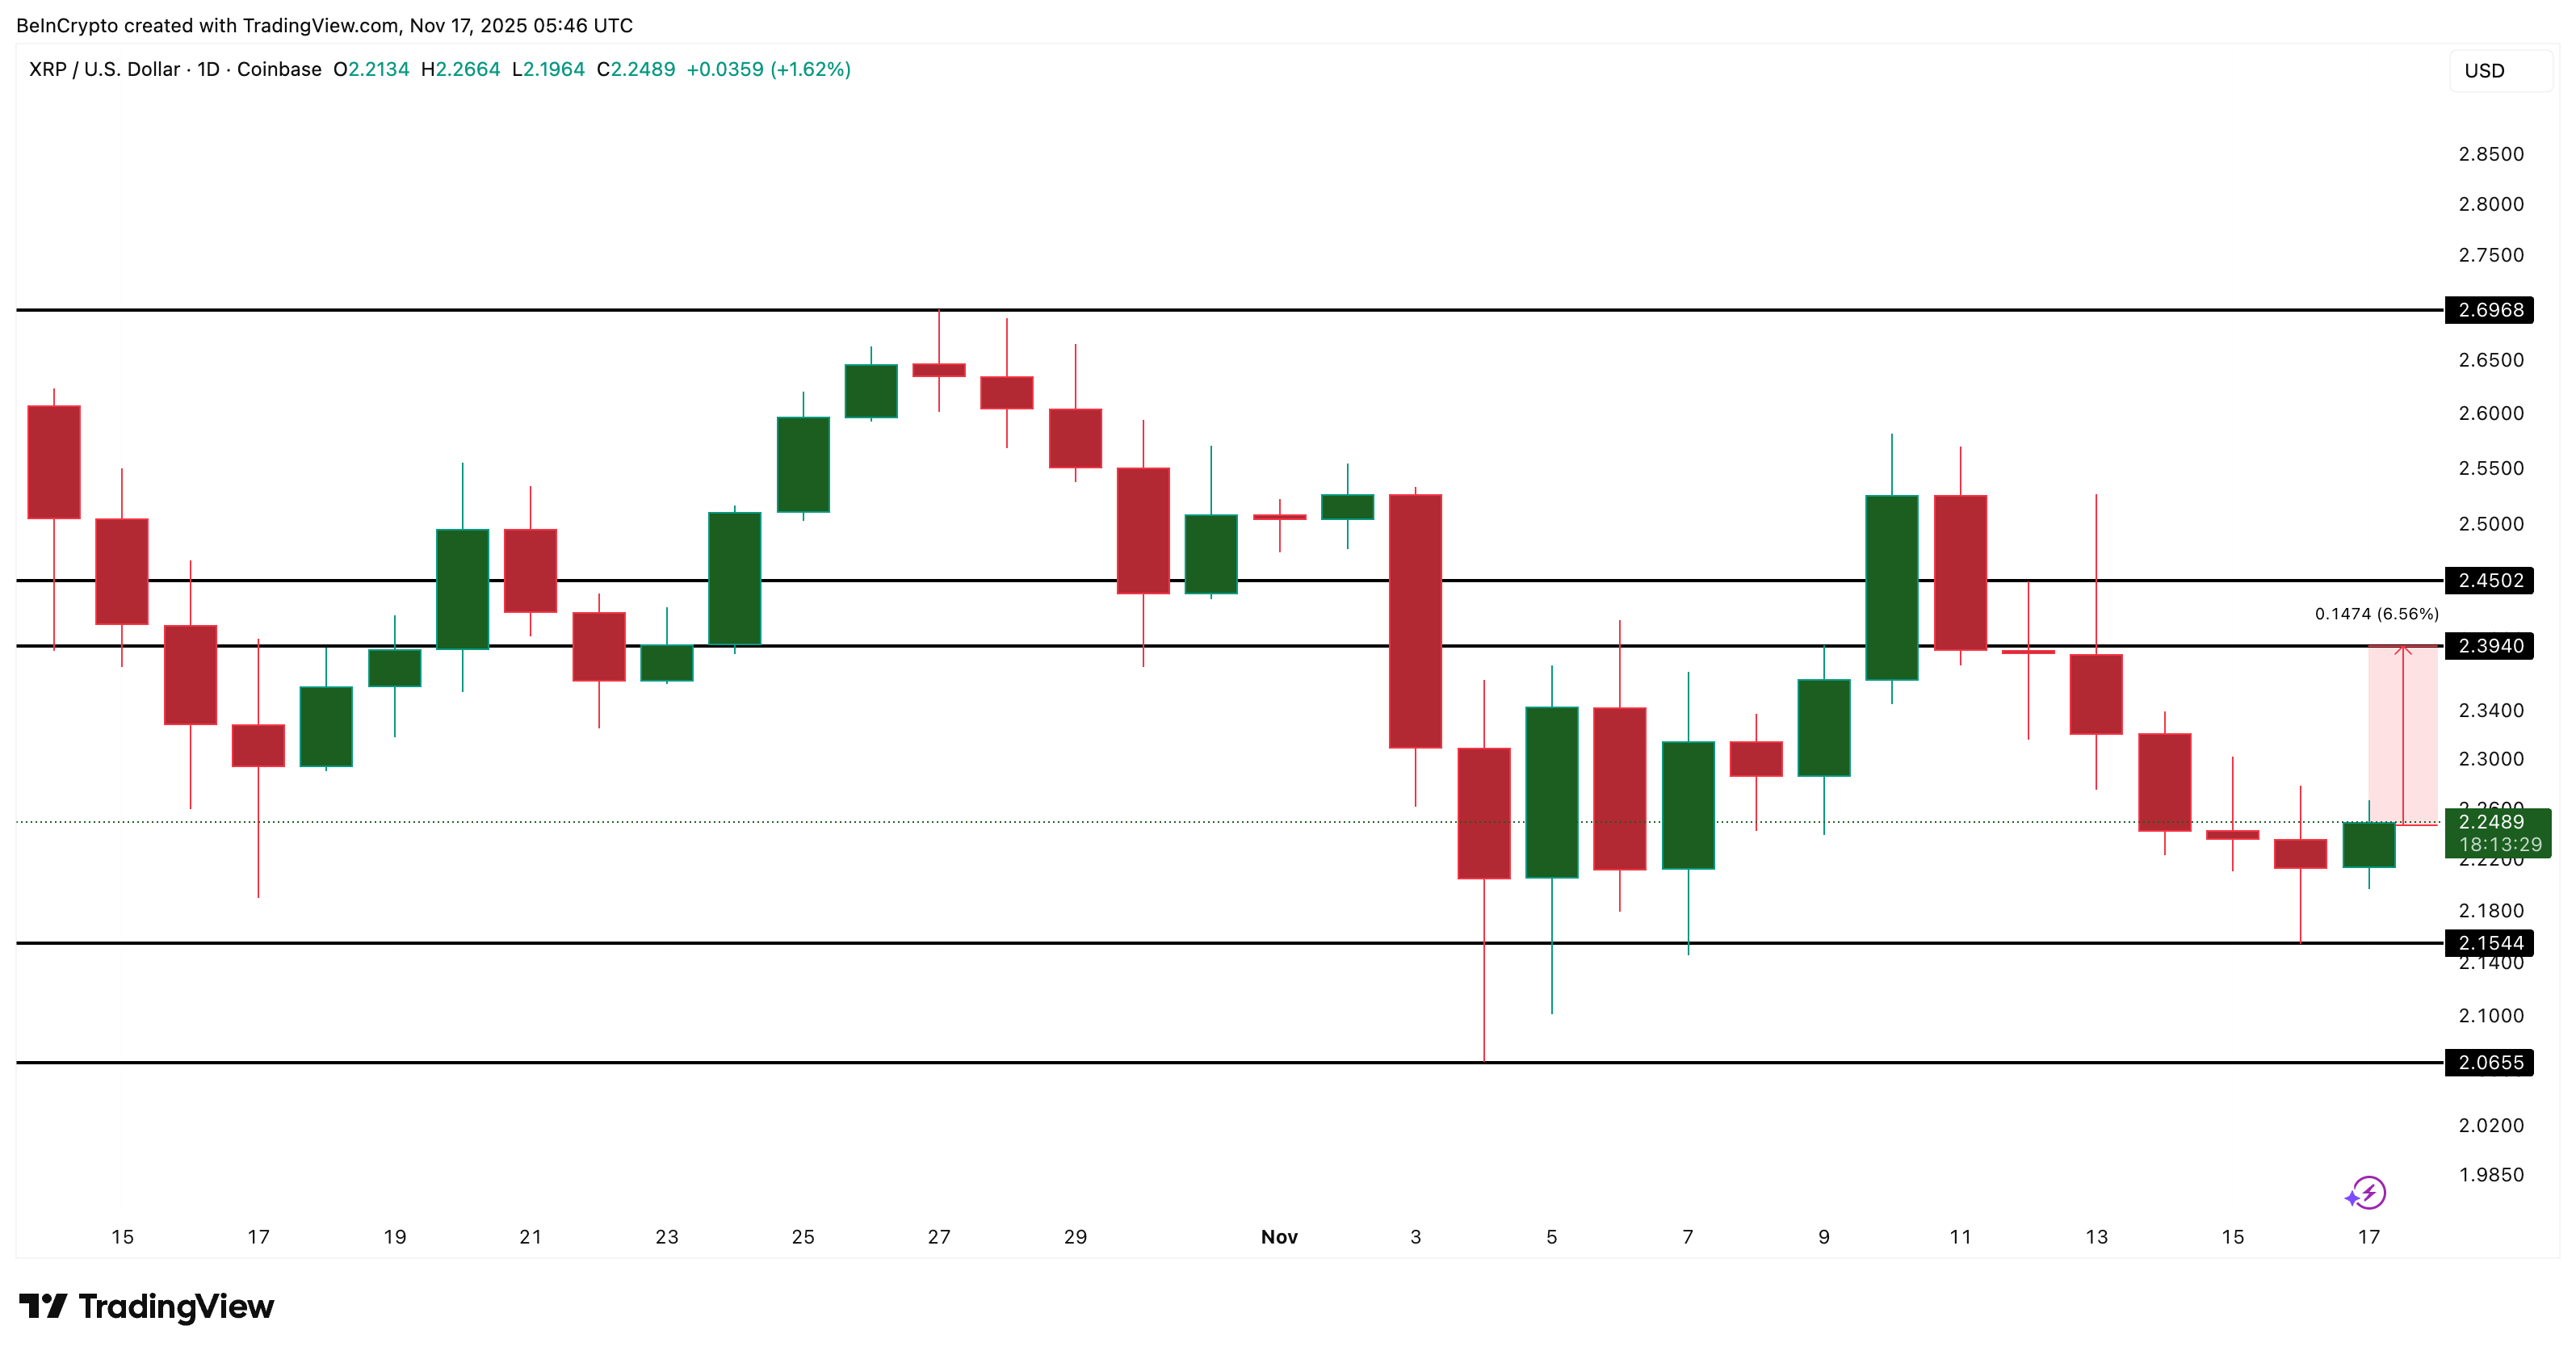 XRP Price Analysis: TradingView
If momentum improves further, XRP can push toward $2.696, and breaking that level brings a much stronger recovery into view.
For now, everything comes down to one question: Can the $2.154 support band survive long enough for sentiment to flip? If yes, the XRP price may be forming the same kind of bottom that drove its last major rally.
The post XRP Price Is One Step From a Breakdown — Or a Cycle Bottom? appeared first on BeInCrypto.


 24h Most Popular


 Utilities