
Supported by vertical accumulation between $1.90 and $3.50 and a bullish divergence on daily charts, XRP is attracting attention from traders and investors alike. Current market data shows XRP trading near $2.21 with solid support levels around $2.09–$2.16, signaling potential for a short-term rebound if resistance at $2.60–$2.80 is overcome.
Institutional Boost: Franklin Templeton Enters XRP
XRP has returned to investor focus following news of Franklin Templeton’s upcoming spot XRP ETF (EZRP), scheduled for launch on November 24, 2025, according to the firm’s updated S‑1 filing. Analysts at TheCryptoBasic estimate first-day trading volumes could reach $150–$250 million, referencing patterns from prior ETF launches such as Bitwise’s XRP product.
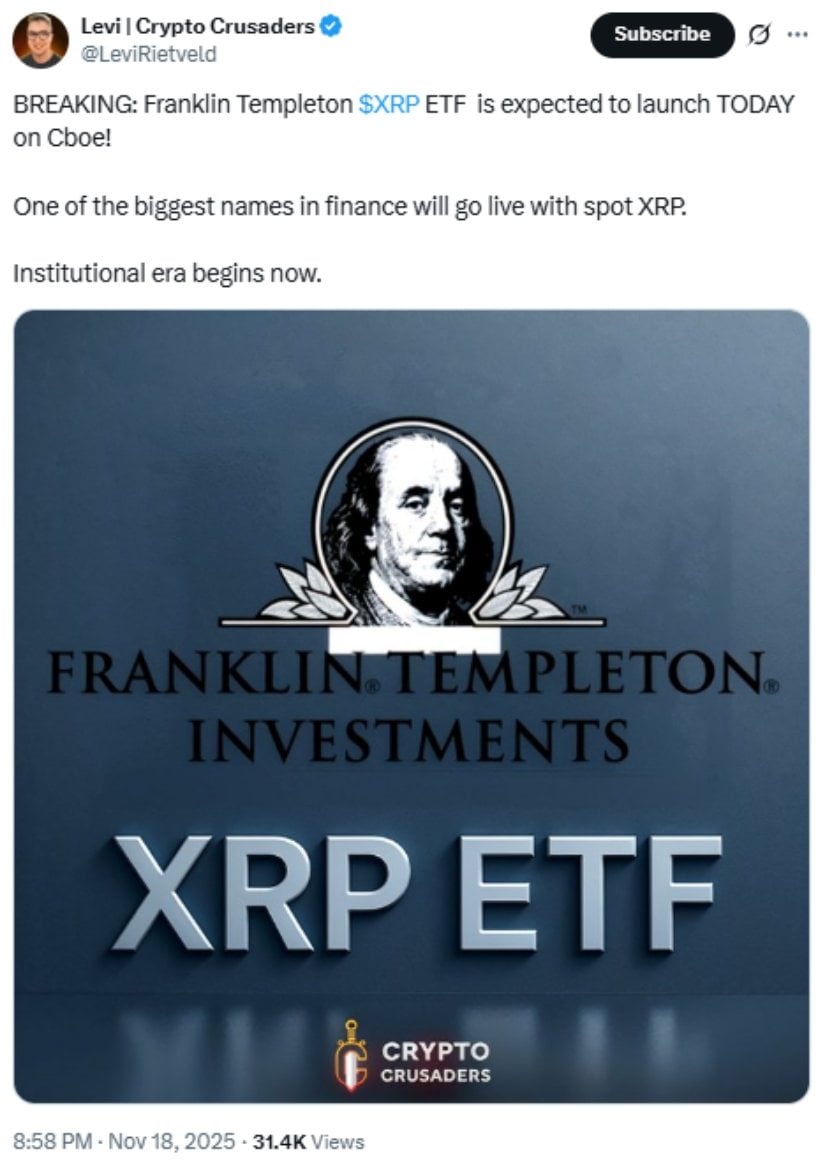
Franklin Templeton launches its spot XRP ETF on Cboe today, marking the start of institutional adoption for XRP. Source: @LeviRietveld via X
“This launch signals a growing interest from regulated institutions,” said Levi Rietveld, Crypto Crusaders. “It allows investors to gain regulated exposure to XRP without holding tokens directly.”
Data from CoinMarketCap indicates that XRP’s circulating supply on exchanges has slightly decreased in recent weeks, potentially tightening available liquidity. However, the long-term impact on price will depend on ETF adoption rates and broader market conditions.
Technical Analysis: Vertical Accumulation and Bullish Divergence
From a technical perspective, XRP is forming vertical accumulation between $1.90 support and $3.50 resistance, based on daily candlestick charts shared by ChartNerdTA. Vertical accumulation represents periods where price consolidates in a narrow range while volume patterns suggest potential smart money accumulation. Historical analogs include similar consolidation phases seen in Bitcoin in 2019–2020, which preceded larger breakouts.
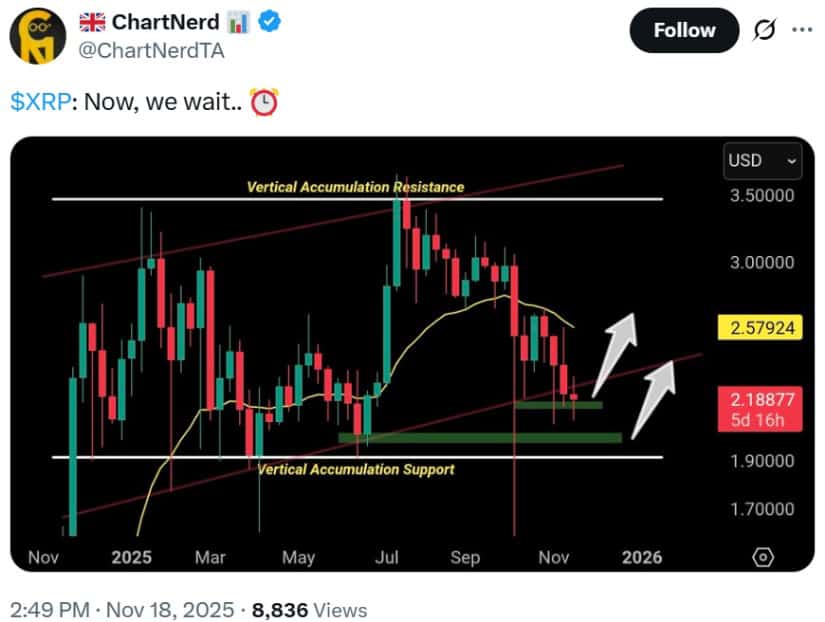
XRP/USD shows vertical accumulation between $1.90–$3.50, with a projected breakout from $2.18 as traders await a post-SEC rally. Source: @ChartNerdTA via X
In addition, XRP is showing a bullish divergence on the daily RSI indicator: while prices recently formed lower lows near $2.16, the RSI indicator rose from around 20 to 38. According to YCharts, such divergence often indicates weakening downward momentum and a possible trend reversal.
Analysts caution that these technical patterns require confirmation. A decisive move above the $2.60–$2.80 resistance zone or strong volume increases would strengthen the bullish thesis, while a drop below $2.09 support could invalidate the scenario.
XRP Current Price and Key Levels
As of November 19, 2025, XRP is trading at approximately $2.21 with a 24‑hour rise of 1.3 % and volume around $7.48 billion, according to Brave New Coin.
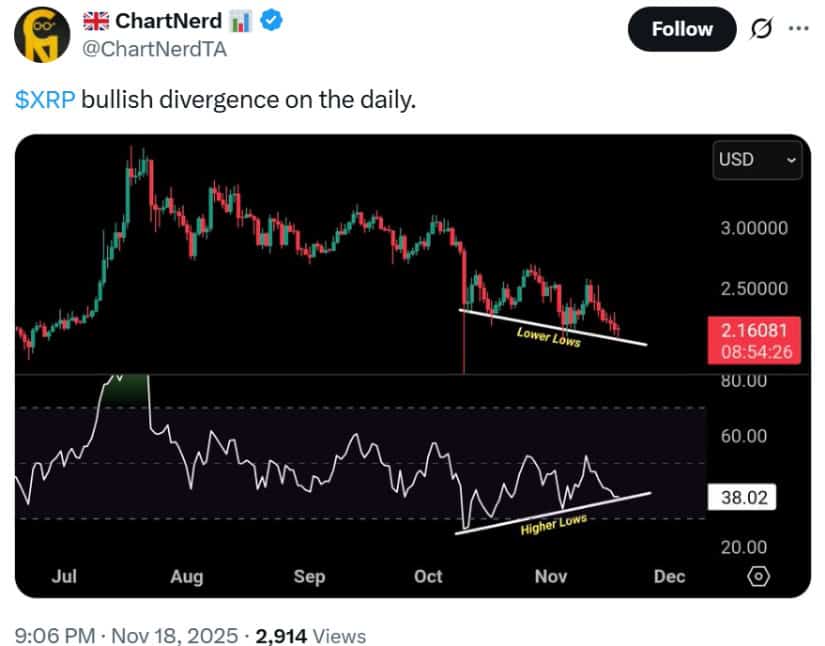
XRP shows a bullish divergence on the daily chart, signaling weakening downward momentum and potential for a trend reversal. Source: @ChartNerdTA via X
Key levels to watch:
-
Support: $2.00–$2.10
-
Resistance: $2.60–$2.80, with higher resistance near $3.00+
Traders should monitor price action closely. A confirmed break above resistance with volume could indicate short-term bullish momentum. Conversely, failure to hold support could trigger a corrective move.
What the Franklin Templeton ETF Means for XRP
The EZRP ETF provides a regulated vehicle for institutional investors to access XRP. According to TheCryptoBasic, ETF inflows could influence market liquidity, especially as fewer XRP tokens remain freely tradable on exchanges.
However, the impact will depend on several factors: adoption rate, ETF approval timelines, and overall crypto market sentiment. While regulated exposure could increase demand, price outcomes are not guaranteed and remain sensitive to broader market dynamics.
Risks to Keep in Mind
Investors should consider both technical and market risks:
-
Outflows from XRP products: Recent data from Glassnode indicates intermittent withdrawals from XRP token products, reflecting short-term caution.
-
Technical uncertainty: Vertical accumulation and bullish divergence are not guarantees; breakouts require confirmation through price action and volume.
-
Regulatory timing: ETF launch dates are subject to change, as seen with EZRP’s adjusted launch schedule.
-
Market conditions: Macro factors, crypto sentiment, and global risk appetite can impact short-term price movements.
Final Thoughts
XRP is currently at a critical juncture. Institutional demand through Franklin Templeton’s ETF, combined with technical signals like vertical accumulation and bullish divergence, presents a potential upside scenario.
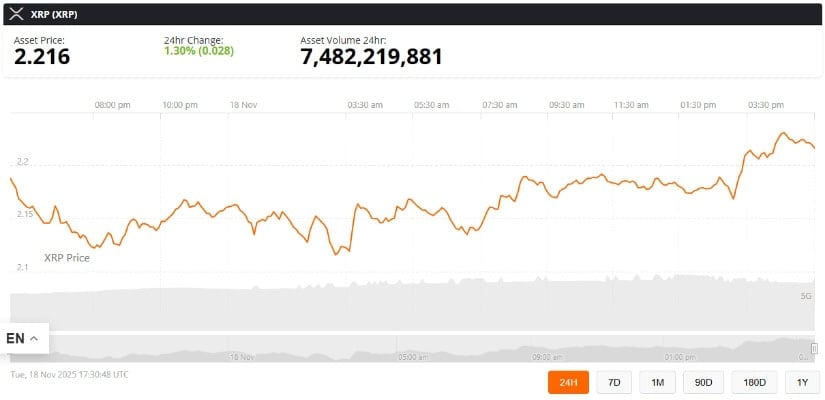
XRP was trading at around 2.21, up 1.30% in the last 24 hours at press time. Source: XRP price via Brave New Coin
Traders and investors should monitor $2.09–$2.16 support closely. If these levels hold and ETF adoption gains momentum, XRP could target $2.70–$4.00, though outcomes are contingent on confirmed market activity.
Balancing optimism with caution is key: while structural developments support potential gains, investors must remain aware of risks and evolving market conditions.


 24h Most Popular


 Utilities