
</a>-300x172.jpg)
Both suggest the altcoin could rebound from the $950–$1,000 support zone, potentially targeting $1,894 and even $5,000 in future cycles.
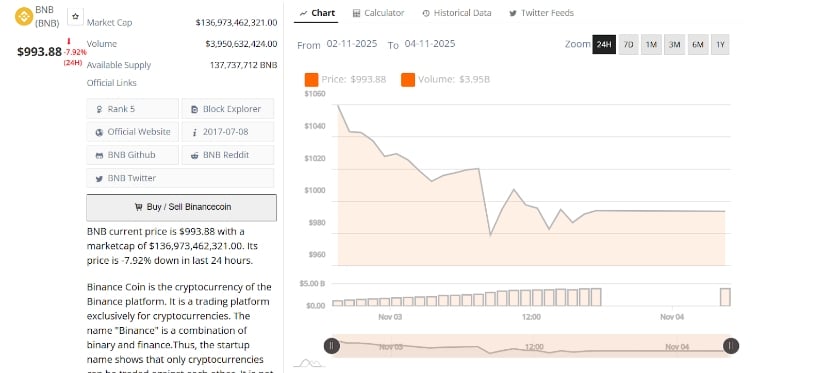
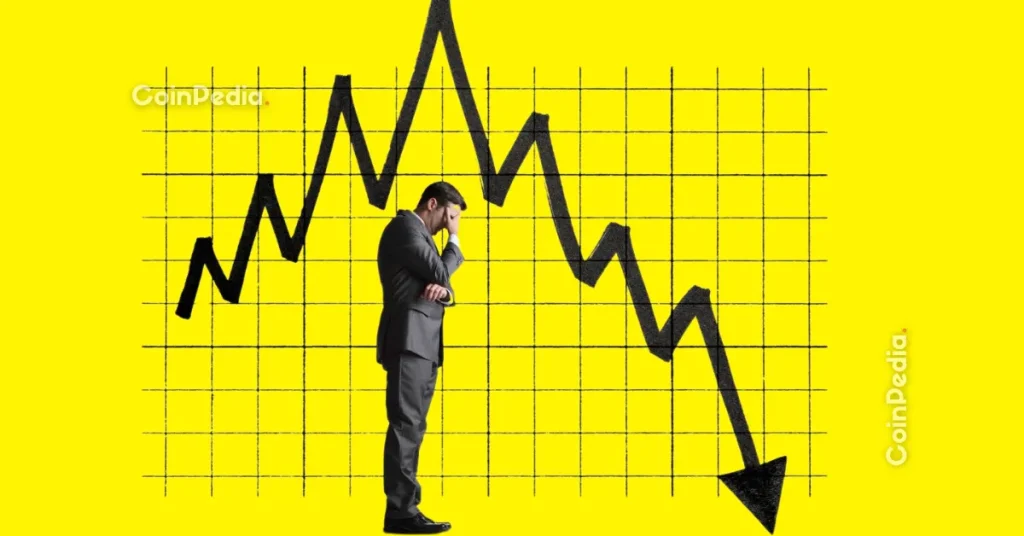
BNB Slips Below $1,000 Amid Strong Selling Pressure
Binance Coin fell below the $1,000 threshold in the past 24 hours, marking an 8% decline. The token is now trading near $989.20, showing a notable shift from its recent peak above $1,060. The sharp retracement suggests increased selling activity across exchanges, with short-term traders reducing exposure ahead of broader market developments.
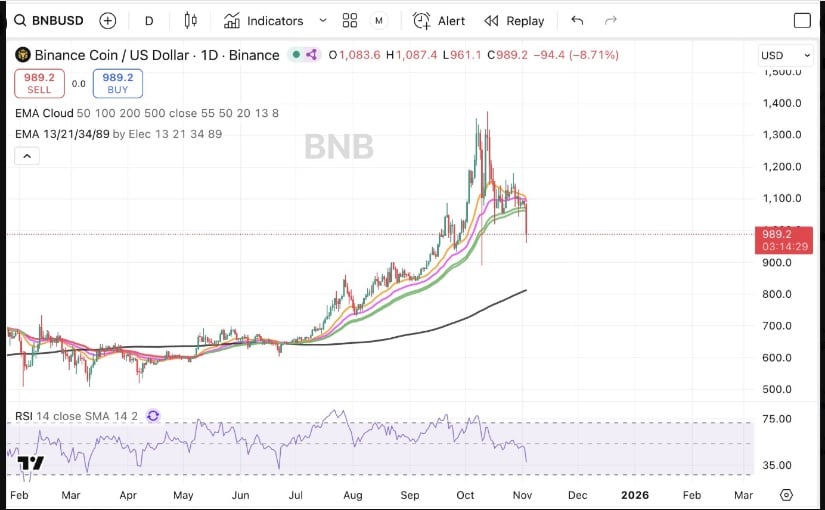
BNBUSD 24-Hr Chart | Source: BraveNewCoin
The daily chart reflects intensified downward momentum, confirmed by extended red candles and a drop below short-term exponential moving averages (EMAs). According to market data, its trading volume surged to $3.95 billion, suggesting that the price action is supported by heightened participation rather than low liquidity. The majority of trades occurred during midday sessions, with heavy sell-offs observed around the $1,020 and $1,000 zones, where multiple support retests failed to hold.
Analyst Views: Short-Term Pressure, Long-Term Structure Intact
Analyst Anonymous | Crypto Predictions maintained that despite the correction, its broader structure remains resilient. The analyst pointed out that binance continues to hover above its key $950–$970 support region, a zone that previously acted as a strong accumulation base in September. According to the chart, the current pullback sits within a healthy consolidation pattern above long-term EMAs, suggesting that the cycle may not have reached its final phase.
BNBUSD Chart | Source:x
The analyst added that its strength could challenge the established four-year market rhythm traditionally dominated by Bitcoin’s cycles. The sustained structure and trend continuity indicate that altcoins may start defining independent trajectories in this market phase. The commentary also touched on macroeconomic pressures affecting crypto sentiment, linking the overall weakness in altcoins to ongoing regulatory and fiscal challenges in the United States.
Analyst’s Elliott Wave Outlook Targets $5,000
In a separate analysis, Crypto Patel shared a multi-year Elliott Wave projection, suggesting a long-term path toward the $4,075–$5,000 range. Patel’s chart shows that it continues to respect its ascending trendline established in 2018, maintaining the pattern that delivered over 700% returns during the last bull market.
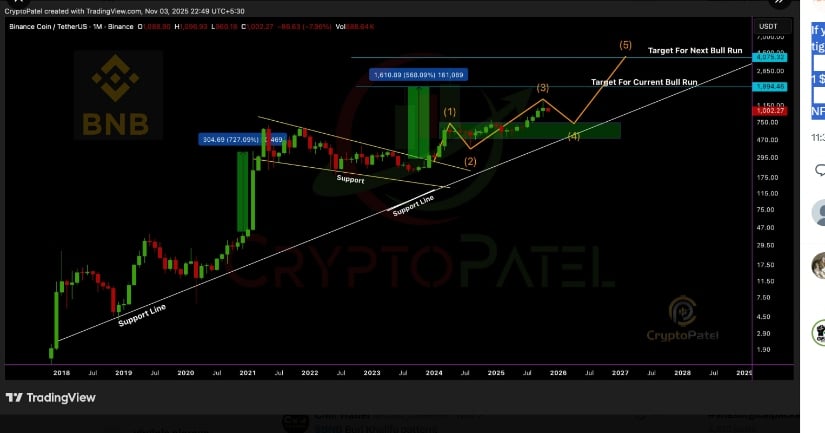
BNBUSD Chart | Source:x
The analyst noted that the coin is currently in a corrective phase near the wave (4) support region, aligning with the $900–$1,000 range, which could serve as a springboard for the next major impulse.
Patel projected that the next upward wave could lift the coin toward $1,894 in the current bullish sequence before advancing toward the $5,000 mark in a future cycle. His assessment emphasizes long-term structural strength and consistency in accumulation across historical support levels. According to his model, long-term holders who maintain exposure during these corrections may benefit from potential upside once momentum returns.
Technical Indicators Show Caution Before Recovery
The Relative Strength Index (RSI) on the daily timeframe currently sits near oversold territory, signaling temporary weakness after consecutive red sessions. Price action remains compressed within the short-term moving average cluster, suggesting that volatility may persist until a decisive reversal forms. Maintaining the $990 region could help stabilize the pair, allowing for gradual reaccumulation and reducing downward momentum.
Failure to sustain current levels could see the asset retest the $980 and $950 supports, which remain critical for defending its mid-term structure. On the other hand, a close above the $1,020–$1,060 range could confirm renewed bullish momentum. For now, analysts maintain that while short-term conditions remain fragile, its long-term trend structure continues to point toward eventual recovery once selling pressure subsides.


 24h Most Popular


 Utilities