.png)
Bitcoin is trading at $107,400 at press time, down 3% in the past 24 hours and 7% over the last week. Traders are watching key price levels as the market tests long-term support.
With volatility dropping and volume remaining high, several analysts are pointing to this monthly close as a potential turning point.
Fibonacci Support Has Held Since 2023
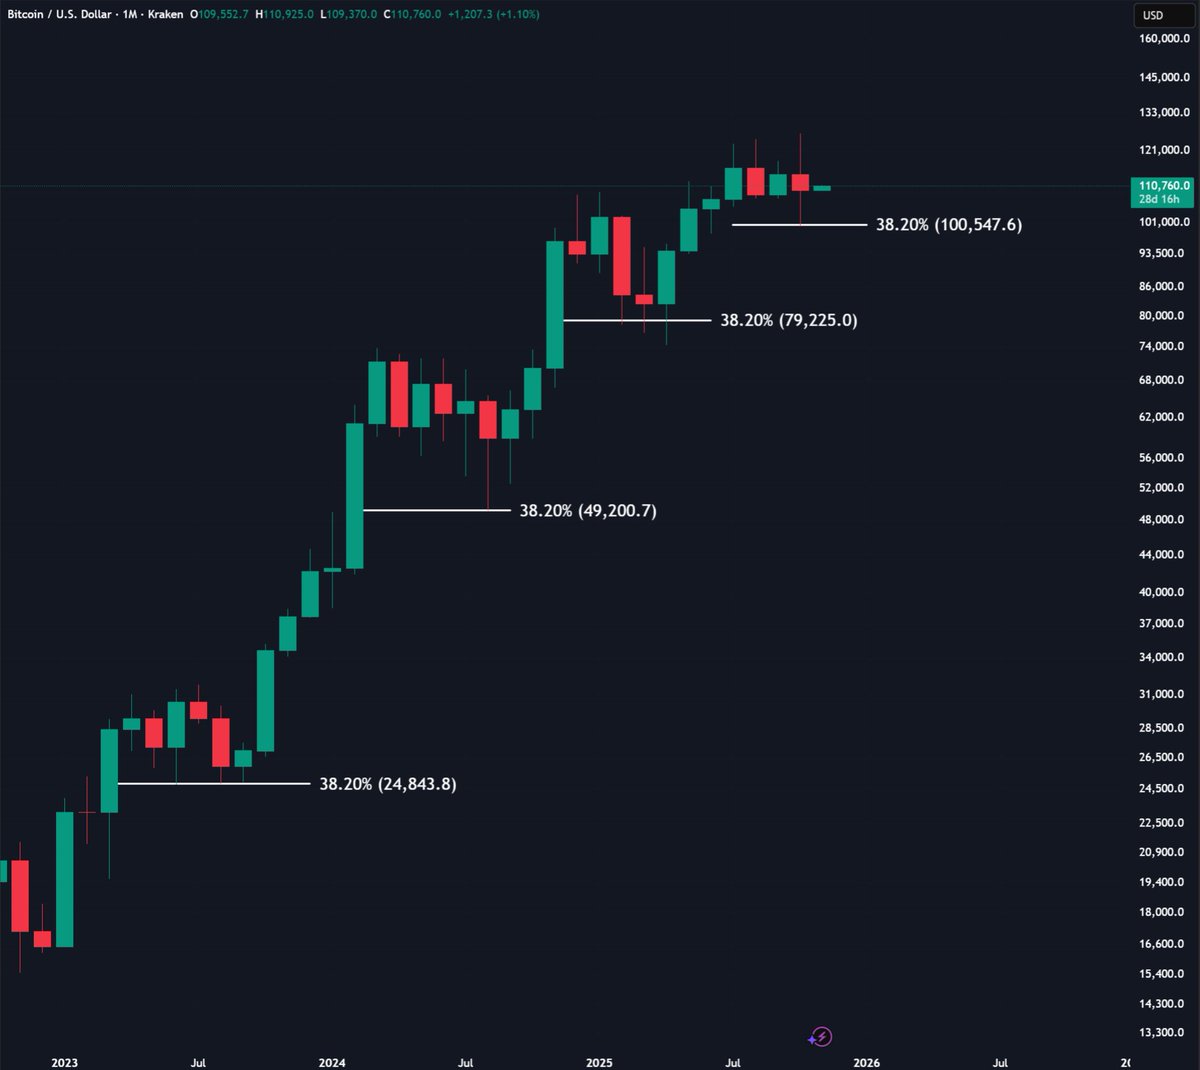
BTC ($106,820.00) has exhibited a transparent trend since the beginning of 2023. Support has been located at the 38.2% Fibonacci retracement level for every significant correction so far. These levels—approximately $24,843, $49,200, $79,225, and currently $100,547—have indicated local bottoms prior to the recovery of the price.
 Source: Cas Abbé/X
Notably, the most recent monthly candle dropped to the $100,500 area and bounced. This level now serves as a key reference point.
According to analyst Cas Abbé, “If BTC closes a monthly candle below it, the bull run will be most likely over.” The price remains above this threshold for now, but the margin is narrowing.
Meanwhile, Bitcoin’s weekly chart is also showing technical stress. According to Super₿ro, the Bollinger Bands are now at their tightest point on record, with the Bollinger Band Width indicator near 15. This level reflects a rare drop in volatility, often seen before sharp price moves.
In previous cycles, similar compression led to short-term dips, followed by rapid reversals to the upside.
$BTC weekly
tightest squeeze in history for the weekly Bollinger Bands
prior squeezes led to a headfake lower and then a rip higher pic.twitter.com/va8UQp5Ifo
— Super฿ro (@SuperBitcoinBro) November 3, 2025
Short-Term Ranges Show Liquidity Zones
During the weekend, two main liquidity areas formed, according to analyst Daan Crypto Trades. BTC took out the lower bound around $108,500, clearing that level. Another cluster remains near $112,000, with stronger interest building between $105,000 and $106,000.
Ted Pillows pointed to large bids around the $106,000–$107,000 zone and added,
“What if we dump in the first week and then pump to a new ATH ($0.02)?”
These levels are also near long liquidation zones, which could trigger more volatility in the short term.
Long-Term Holders Are Selling Into Strength
Data from CryptoQuant shows that long-term holders sold over $33 billion worth of BTC in October. This created daily selling pressure of up to $1 billion. CryptoPatel noted that these units came from addresses active across multiple market cycles.
“These aren’t weak hands. These are OGs booking profits near the top,” they said.
Demand from US investors has slowed in recent weeks, and some large traders have started taking short positions. One of them is Peter Brandt, who confirmed a short in Bitcoin futures. The market is still digesting these changes, as prices trade below recent highs.
The post Bitcoin Bull Run in Danger? BTC Tests Critical Support Again appeared first on CryptoPotato.


 24h Most Popular


 Utilities