.png)
Bitcoin is holding near $90,000 while supply on exchanges continues to fall. Recent data points to lower selling activity, as more BTC ($90,077.00) moves into long-term storage.
At the same time, traders appear to be reducing risk, and the price structure is showing signs of strength despite recent volatility.
Deposits to Exchanges Keep Dropping
Bitcoin inflows to exchanges are now around 21,000 BTC, according to CryptoQuant. That’s a sharp drop from 88,000 BTC seen in 2021 and well below the 126,000 BTC level recorded during the last market peak. Crypto Tice commented,
“When exchange deposits collapse like this, sell pressure evaporates.”
Many holders are moving BTC to cold wallets, custodians, or ETFs. This reduces the liquid supply and can increase sensitivity to demand changes, especially if buying pressure returns.
In addition to fewer deposits, Bitcoin is steadily being withdrawn from exchanges. Over the last year, around 403,200 BTC have been withdrawn from centralized platforms, as CryptoPotato recently reported. This equals about 2.1% of Bitcoin’s total circulating supply and reflects a broader move toward long-term holding.
Meanwhile, the market is showing signs of lower leverage. CryptoQuant analyst Arab Chain noted that the estimated leverage ratio on Binance has dropped to 0.163, below recent averages of 0.18 or higher. “The market is undergoing a sensitive period,” he said, pointing to the more cautious stance among traders. This reduction in leverage also helps limit extreme price swings, often driven by liquidations during high volatility.
Support Holds as Price Compresses
Bitcoin has been trading between $89,400 and $93,400 in the past 24 hours, with support near $90,800 holding being tested to the downside. Michaël van de Poppe said the price is forming higher lows, suggesting a possible upward breakout. “Price clearly doesn’t break down anymore,” he noted, adding that recent downside moves appeared to lack organic selling.
The market is showing signs of compression. Analyst Lennaert Snyder noted that BTC continues to reject the $94,000 level and is forming a tight range. He explained that breaking above this zone may open the way toward $99,000 or higher. In contrast, if it breaks below $89,800, a move toward $87,600 could follow.
Simultaneously, Merlijn The Trader pointed to the monthly MACD showing a bearish cross, similar to the setup in 2019. Despite that signal, BTC is holding above its 20-month moving average.
“Smart money sees a launchpad,” he commented.
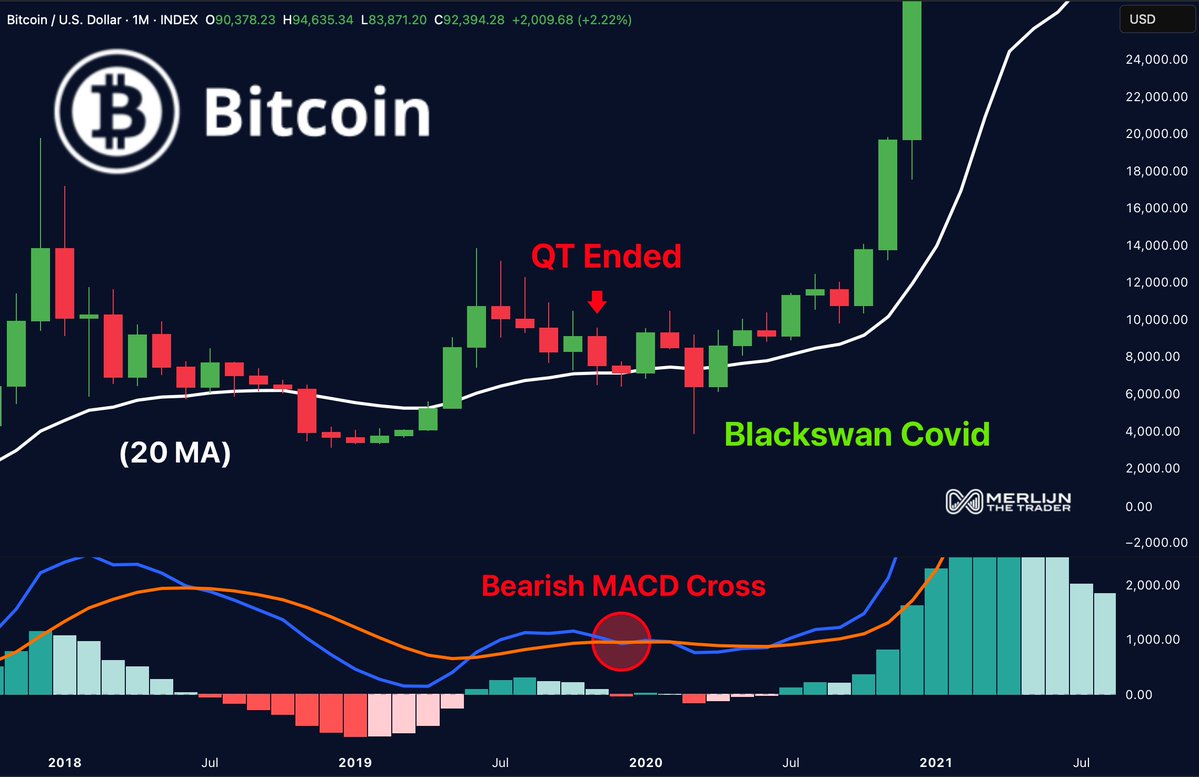 Bitcoin (BTC) Price Chart 12.12. Source: Merlijn The Trader/X
In 2019, this same technical structure formed shortly after the Federal Reserve ended quantitative tightening. Bitcoin went on to rally by over 600%. Analysts are watching to see if similar conditions are now forming again.
The post Bitcoin Selling Pressure Fades: So Why Is BTC Still Stuck? (Analyst) appeared first on CryptoPotato.


 24h Most Popular


 Utilities