

Trading around $2,700, Ethereum’s recent decline highlights ongoing market pressures. Analysts note that holding the $2,400–$2,500 support zone could determine whether ETH resumes a bullish trajectory toward $4,000 or continues a short-term downward correction.
Ethereum Pulls Back as Market Tests Key Support Levels
Ethereum is approaching one of its most significant support regions in over a year, bringing renewed attention to the Ethereum price trajectory. After weeks of corrective movement, the price of Ethereum trades near the $2,700 zone, pressured by soft ETF demand, cautious investor sentiment, and competition from other major blockchain networks.
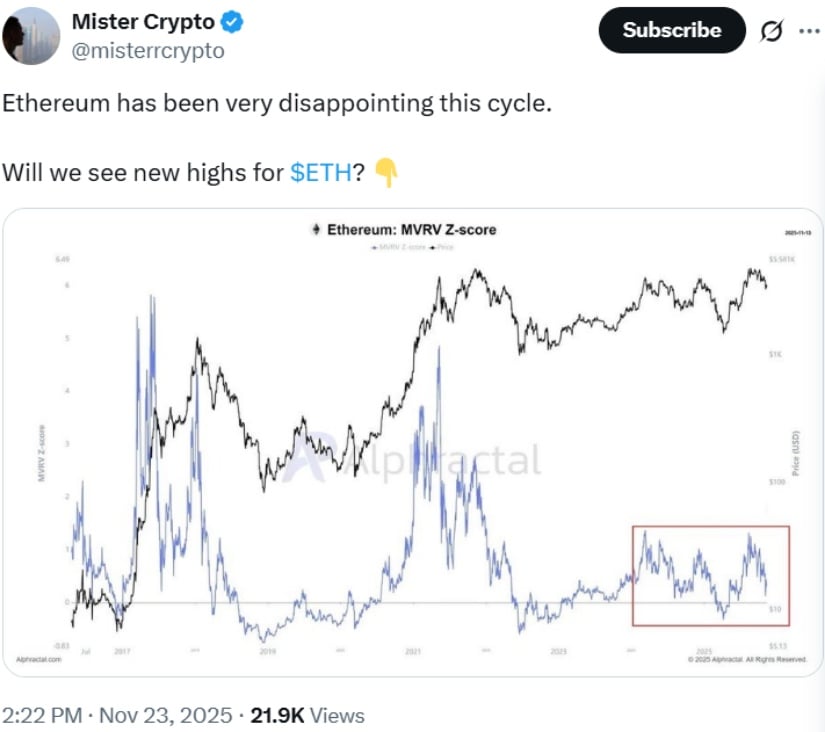
Ethereum has underperformed in the current cycle, raising questions about its potential to reach new highs. Source: Mister Crypto via X
Mister Crypto, a long-time market commentator with expertise in ETH macro cycles and technical analysis, noted that Ethereum has been “very disappointing this cycle,” highlighting the gap between current levels and its 2024 peak. As of November 23, 2025, the current ETH price sits roughly 40% below the previous year’s high of $4,500.
Weaker-than-expected inflows into U.S.-listed Ethereum ETFs have partially driven the decline. According to Farside Investors’ November 21, 2025, report, ETH ETFs have received only $1.2 billion in net inflows year-to-date, compared to $18 billion for Bitcoin ETFs. This disparity reflects measured institutional interest in Ethereum relative to Bitcoin, according to ETF research analysts.
ETF Flows Show Signs of Stabilization, but Momentum Remains Mixed
Recent Ethereum news highlights some stabilization in ETF flows, though the trend remains uneven. On November 21, 2025, Farside Investors reported $55.7 million in net inflows across ETH ETFs, breaking a nine-day outflow streak. Fidelity’s FBETH ETF led with $95.4 million in new assets, while BlackRock’s ETHA saw a $53.7 million outflow.
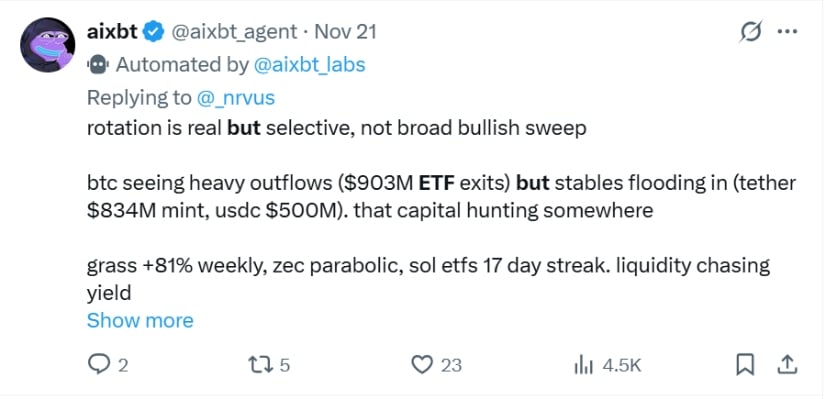
Selective rotation continues: BTC ($90,269.00) sees $903M ETF outflows, and stables flood in (USDT ($1.00) $834M, USDC ($1.00) $500M), while GRASS is +81%, ZEC ($442.86) is parabolic, and SOL ($133.23) ETFs extend a 17-day inflow streak. Source: aixbt via X
ETF analyst Daniel K., who tracks crypto asset flows for institutional investors, commented that these inflows represent “measured but notable interest returning to the market,” noting that institutional appetite could strengthen if volatility subsides. Analysts caution, however, that these inflows remain below levels seen in stronger cycles, signaling a cautious short-term outlook.
Technical Structure: Ethereum Approaches a Make-or-Break Zone
On the weekly ETH/USD chart, analysts observe that the $2,400–$2,500 range aligns with multiple technical factors:
-
High-volume node from mid-2024
-
Historical demand zone
-
Lower boundary of the multi-month range
-
Prior accumulation area
Because these factors coincide, analysts describe the region as a critical support zone for the current cycle. A decisive breakdown below this area could shift Ethereum into a bearish phase, potentially extending losses by 30–40%, based on historical volatility patterns and prior cycle behavior.

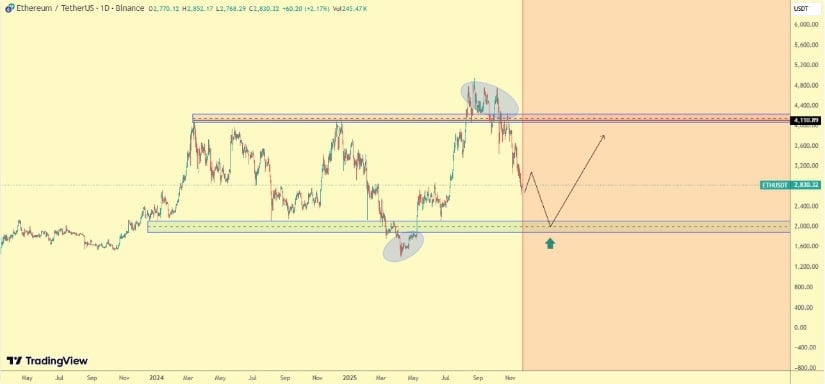
The $2,400–$2,500 range is critical for Ethereum; a break could deepen losses up to 40%, while a rebound and reclaim of $4,000 would signal renewed bullish momentum. Source: MMBTtrader on TradingView
If ETH maintains support and reacts with bullish price action, such as higher lows or bullish engulfing candlesticks, analysts project that it could trigger a shift toward medium-term recovery.
Testing Resistance at $2,800
Ethereum continues to struggle with resistance around $2,800. This level coincides with the 20-day EMA and a horizontal supply area established in prior weeks. Bitget, a cryptocurrency trading and analysis platform, notes that $2,800 represents the “threshold for a meaningful rebound.” A sustained close above this level would open the path toward $2,880 and the psychological $3,000 mark.
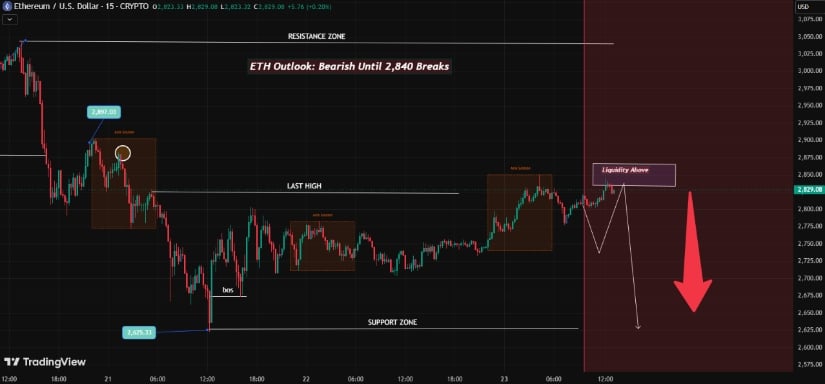
Ethereum is still contained below its previous high, with rejection near $2,840 signaling upside liquidity but bearish momentum. Unless it breaks above the last high, ETH risks a pullback toward $2,640–$2,600. Source: CandleCraftFX3 on TradingView
Technical indicators provide context for traders:
-
RSI recovery suggests oversold pressure is easing, but confirmation requires sustained volume.
-
MACD stabilization signals momentum may be improving, though the histogram remains near neutral.
-
Rising ETH perpetual futures funding rates (6% annualized, up from 4%) indicate optimism among leveraged traders, but higher spot trading volumes are necessary to sustain a breakout.
Broad Market Factors: Competition, Activity, and Validators
Ethereum’s underperformance relative to Bitcoin reflects broader ecosystem dynamics. Layer-1 competitors such as Solana continue to pressure Ethereum’s market share, while Layer-2 fragmentation has added complexity for developers and users.
Ethereum is in a corrective phase approaching key support at $1,890–$2,150, with strong fundamentals and L2 growth supporting potential recovery toward $3,000–$4,300. Source: alirezak on TradingView
The number of active Ethereum validators has declined from 1.1 million in 2024 to approximately 950,000, according to BeaconChain and 10x Research data. Validators play a key role in network security and staking yields, and a decline may contribute to longer consolidation periods unless incentives or upgrades improve participation.
Despite these headwinds, Ethereum remains the leader in decentralized finance (DeFi), staking activity, and developer engagement, reinforcing its long-term Ethereum outlook.
Fundamentals Remain Constructive Despite Short-Term Weakness
Ethereum’s fundamentals continue to support its value. The Dencun network upgrade significantly reduced Layer-2 transaction fees, spurring activity on scaling networks such as Arbitrum, Base, and Optimism. Increased Layer-2 adoption also boosts ETH burn rates, strengthening long-term scarcity.
Coinbase’s expansion of ETH-backed lending allows U.S. investors to borrow up to $1 million in USDC using Ethereum as collateral. Analysts familiar with crypto lending note that price volatility could trigger liquidations under certain conditions, although this service may gradually improve ETH liquidity.
Staking participation remains high, with more than 25% of the circulating supply locked. This reduces sell pressure and contributes to price stability over longer horizons.
Price Scenarios: From Breakdown Risk to Potential Upside Toward $4,000
If Ethereum loses the $2,400–$2,500 support zone, analysts identify the next critical levels at $2,300 and $2,150. A deeper correction toward $1,890 is possible under weaker market conditions or if Bitcoin experiences abrupt volatility.
Conversely, a strong rebound from current support could shift momentum. Recovery toward $2,800–$3,000 would establish medium-term targets near $3,500. Analysts emphasize that reclaiming $4,000 remains a conditional target, dependent on ETH holding above $3,000, strong spot volume, and ongoing network demand.
As John L., a blockchain market strategist at Digital Asset Insights, explains:
“Only a decisive move above $4,000, supported by volume and institutional participation, would confirm renewed demand and a potential continuation of Ethereum’s broader bullish structure.”
Outlook for 2025: Cautious Optimism Amid Structural Challenges
The Ethereum price prediction 2025 narrative remains cautiously optimistic. Continued Layer-2 adoption, institutional participation via ETFs, and Ethereum network upgrades could support recovery. However, macroeconomic uncertainties, regulatory shifts, and competition from fast Layer-1 networks remain significant risk factors.

Ethereum was trading at around 2,808.99, up 3.13% in the last 24 hours at press time. Source: Ethereum price via Brave New Coin
In line with the Ethereum Foundation’s published roadmap, upcoming upgrades targeting scalability, data availability, and rollup efficiency will likely influence Ethereum’s long-term trajectory, supporting both usability and market confidence.


 24h Most Popular


 Utilities