
Bitcoin has dropped below $100,000 for the second time in a week, losing 12% in a month. The overall crypto market has lost over $700 billion in the past month, as the Fear and Greed Index has fallen to ‘extreme fear’.
So, do all of these market indicators signal a bear market? Let’s analyze the technical and historical data.
Sentiment Signals Are at Bear-Market Levels
The Fear & Greed Index at 10 reflects extreme fear comparable to early 2022 and June 2022, both confirmed bear-market phases.
- Yesterday: 16
- Last week: 20
- Last month: 28
The trend shows accelerating fear, not stabilizing sentiment. Bear runs usually begin with this kind of persistent fear compression.
However, sentiment alone does not confirm a bear market — it only signals capitulation or exhaustion.
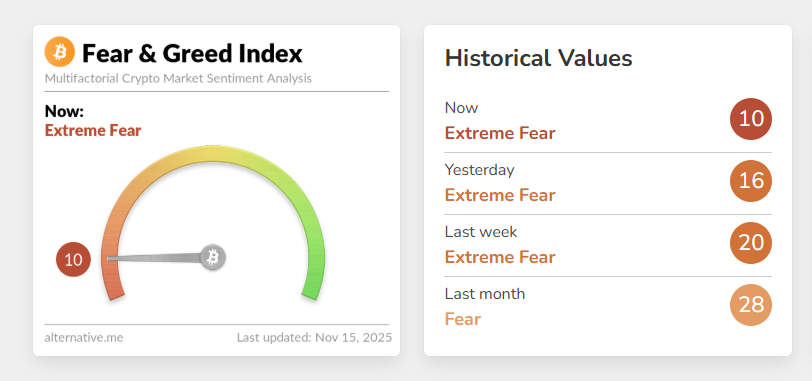 Crypto Fear & Greed Index. Source: Alternative
Bitcoin Has Broken Its Most Important Bull-Market Support
The 365-day moving average is the long-term structural pivot.
Current situation:
- The 365-day MA is near $102,000.
- Bitcoin is trading below it.
- The breakdown mirrors December 2021, when price lost the same MA and the bear market started.
Historically:
| Cycle | MA Lost? | Outcome |
| 2018 | Yes | Full bear market |
| 2021 | Yes | Full bear market |
| 2025 | Yes (now) | Bear-phase risk rising |
Failing to reclaim this level quickly often confirms a cycle regime shift. This is one of the strongest technical arguments for a bear-market transition.
On-Chain Cost Basis Shows Early Capitulation, Not Distribution Top
The 6–12 month UTXO (Unspent Transaction Output) realized price now sits around $94,600. Bitcoin price currently stands slightly above this level.
This matters because:
- These holders bought during the ETF rally.
- They represent “bull-cycle conviction buyers.”
- When their position enters loss, market structure weakens.
In 2021, Bitcoin price falling below this cohort’s cost basis was one of the final signals before the extended downtrend. This is the first time that cost-basis stress has reappeared since 2022.
This supports the idea of a mid-cycle break, not yet a full macro bear trend.
RSI Shows Oversold Conditions, Typical of Mid-Cycle Crashes
Market-wide RSI readings:
- Average crypto RSI: 43.09
- BTC RSI is among the lowest in large caps
- Only 2.5% of assets are overbought
- Most are in oversold territory
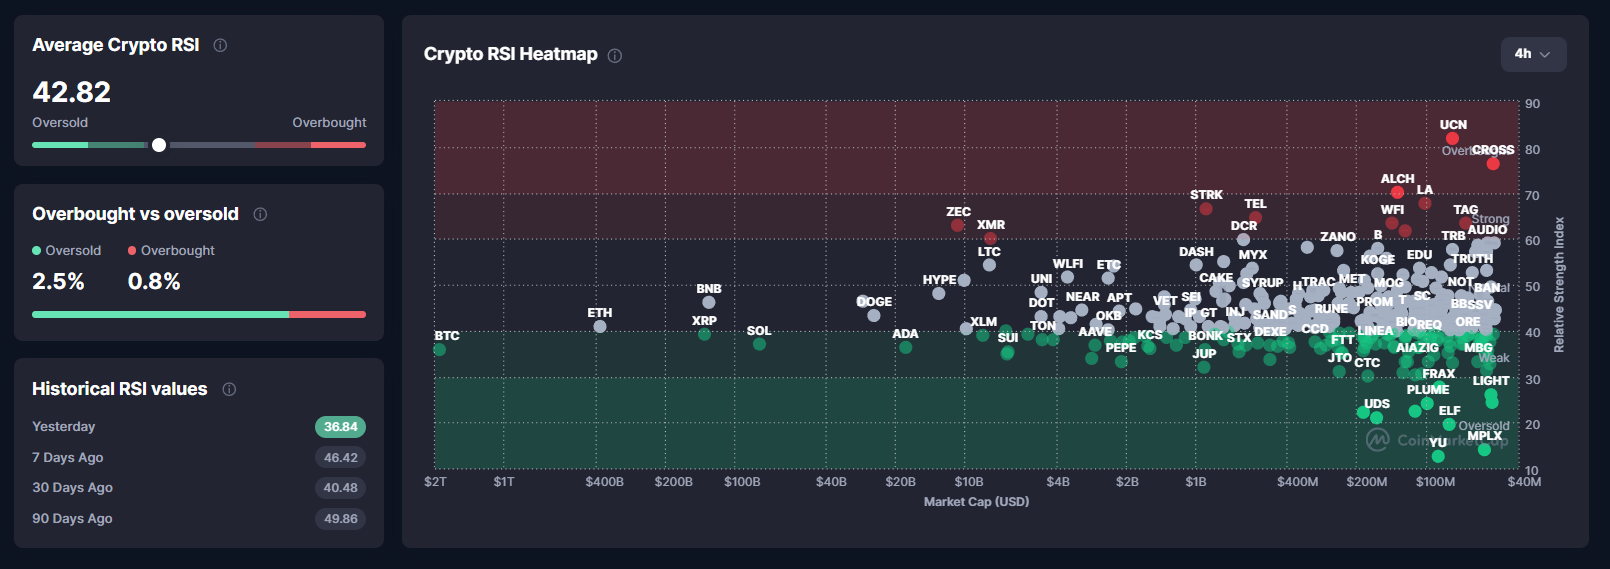 Crypto Market Average RSI. Source: CoinMarketCap
This resembles May–July 2021, August 2023, and August 2024. Each was a mid-cycle correction, not an end-of-cycle bear. When RSI stays deeply oversold for weeks, bearish momentum confirms.
Right now, RSI shows stress but not yet trend reversal.
MACD Shows Strong Divergence Across the Market
The average normalized MACD is currently 0.02. This indicates weak bullish momentum returning. Also, 58% of the market assets have positive momentum.
Bitcoin, however, sits deep in the negative zone while altcoins are mixed.
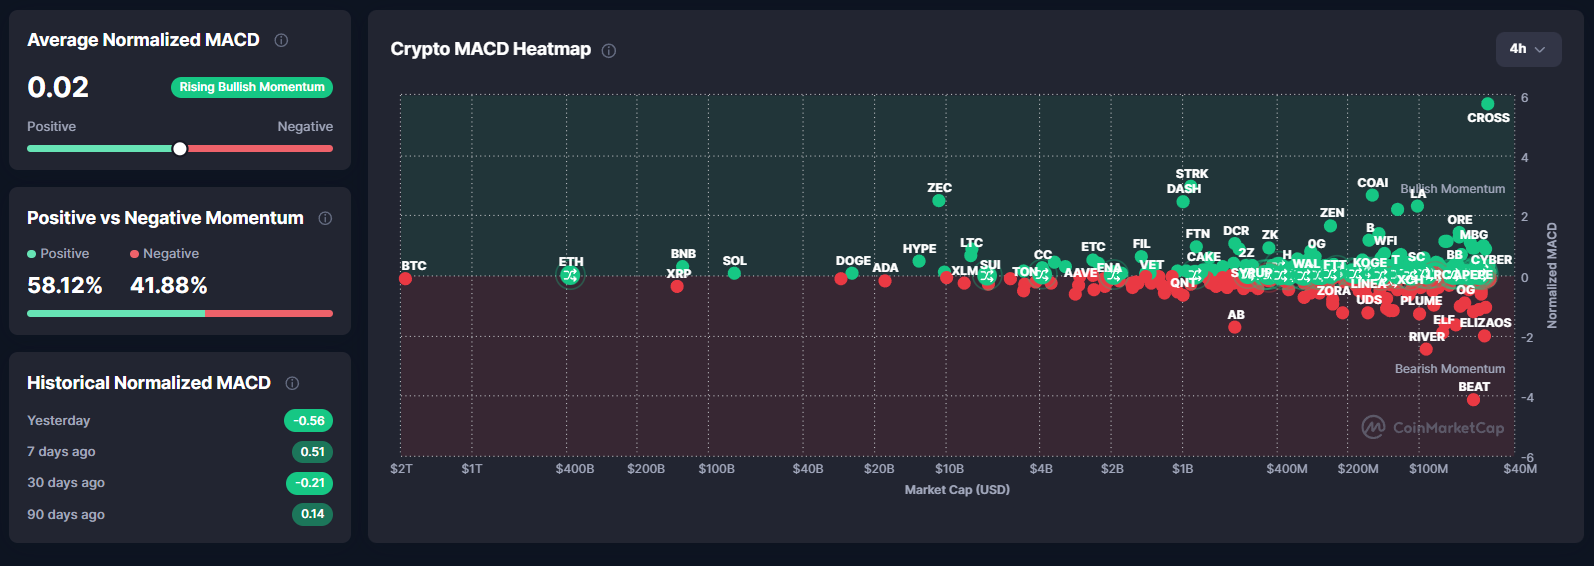 Crypto Market Average MACD (Moving Average Convergence Divergence). Source: CoinMarketCap
When BTC has negative MACD but the market still has 50%+ positive momentum, the market is in a transition phase rather than a full bear trend.
In full bear markets, 90%+ of assets show negative MACD simultaneously. Right now, that is not the case.
So, Is This a Bear Market?
The crypto market is not in a confirmed bear market — it is in a mid-cycle breakdown with a rising probability of becoming a bear market if two conditions are met.
These are the three conditions that would confirm a bear run:
- Bitcoin remains below the 365-day MA for 4–6 weeks. This triggered every bear market in 2014, 2018, and 2022.
- Long-term holders continue heavy distribution. If LTH (long-term holder) selling exceeds 1M BTC over 60 days, the cycle top is in.
- MACD flips fully negative across the entire market. We are not there yet.
Overall, crypto is not yet in a bear market, but the current breakdown puts the market in a high-risk zone where a bear market could form if Bitcoin fails to reclaim long-term support soon.
The post Is Crypto in a Bear Market Now? A Full Market Structure Assessment appeared first on BeInCrypto.


 24h Most Popular


 Utilities