
October hasn’t been kind to the XRP ($2.07) price. The token has dropped more than 12% this month, echoing a similar slump seen in October 2024. As November begins, traders are wondering if XRP can repeat its historic November performance when it rallied over 280% last year. XRP traders might be pleased even with a fraction of that.
On-chain data now shows a mixed setup — with most holders selling, a few whales accumulating, and the price trading inside a narrow pattern that could break either way.
Long-Term and Short-Term Holders Are Still Cashing Out
The Hodler Net Position Change metric, which tracks the difference between XRP entering and leaving long-term wallets, shows that long-term holders are cashing out more aggressively.
On October 19, outflows stood at –3.28 million XRP, but by October 30, they had deepened to –90.14 million XRP.
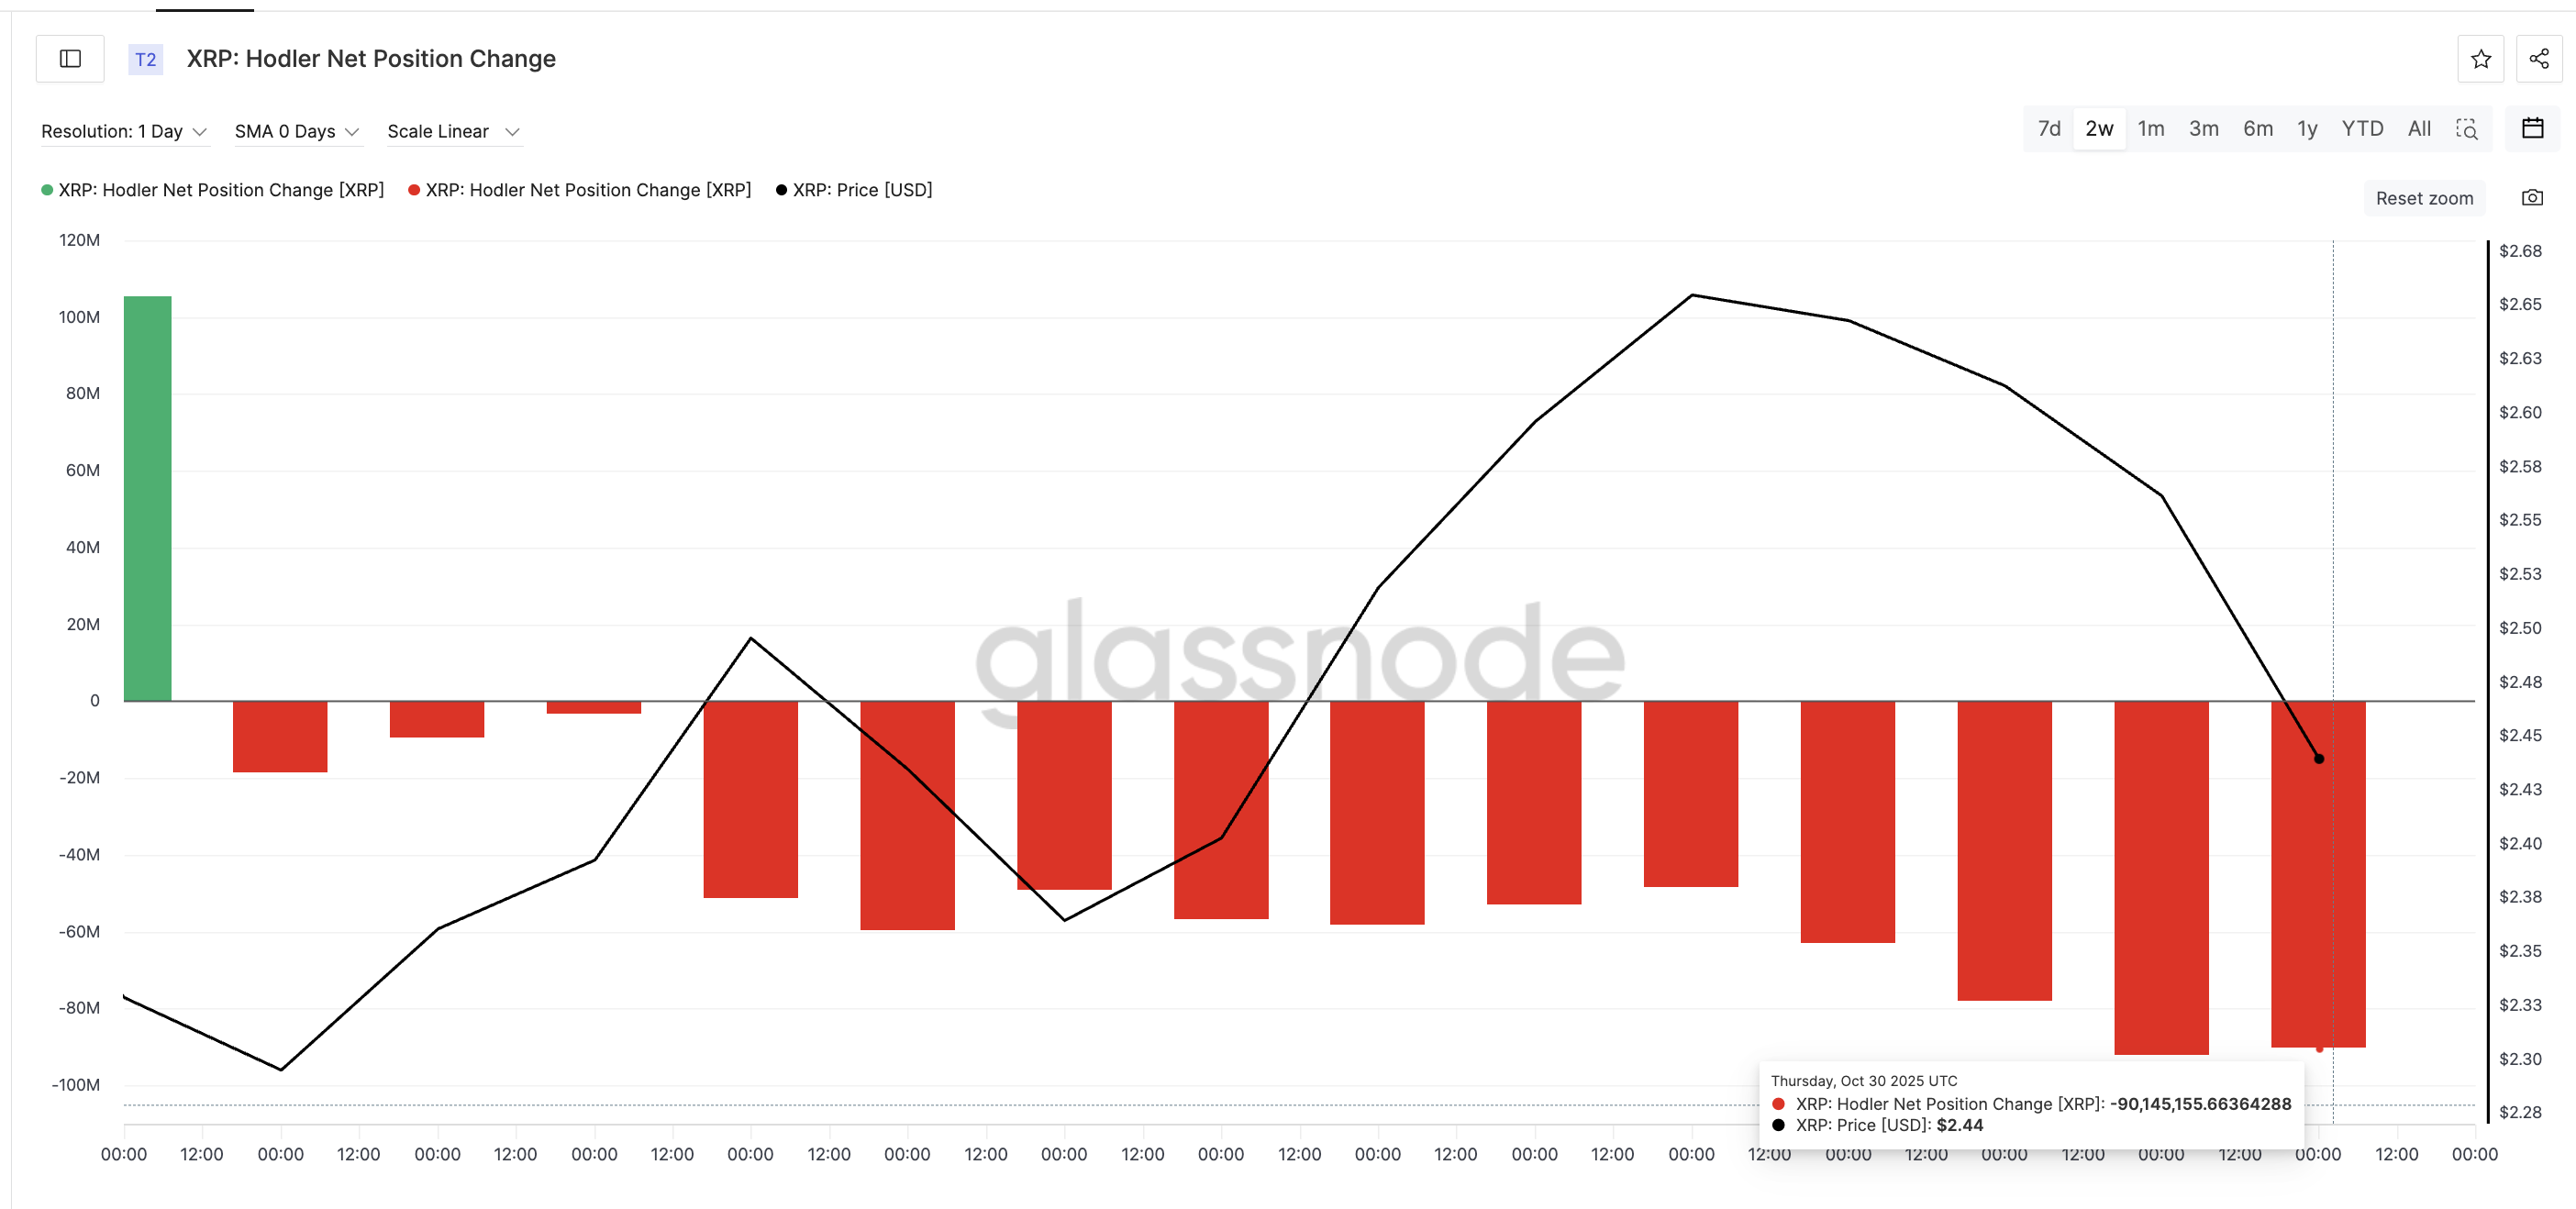 Holders Dumping: Glassnode
Want more token insights like this? Sign up for Editor Harsh Notariya’s Daily Crypto Newsletter here.
That’s a 2,647% increase in net XRP outflows over two weeks, showing that long-term investors have accelerated selling rather than slowing it down.
The Hodl Waves chart, which breaks XRP’s supply into age bands, reveals a similar pattern among short-term holders. The 1–3 month cohort, representing relatively new investors, has seen its share of supply plunge from 12.98% at the start of October to just 7.85% now — a sharp 39.5% decline. This steady fall signals that short-term traders have been exiting as volatility picked up.
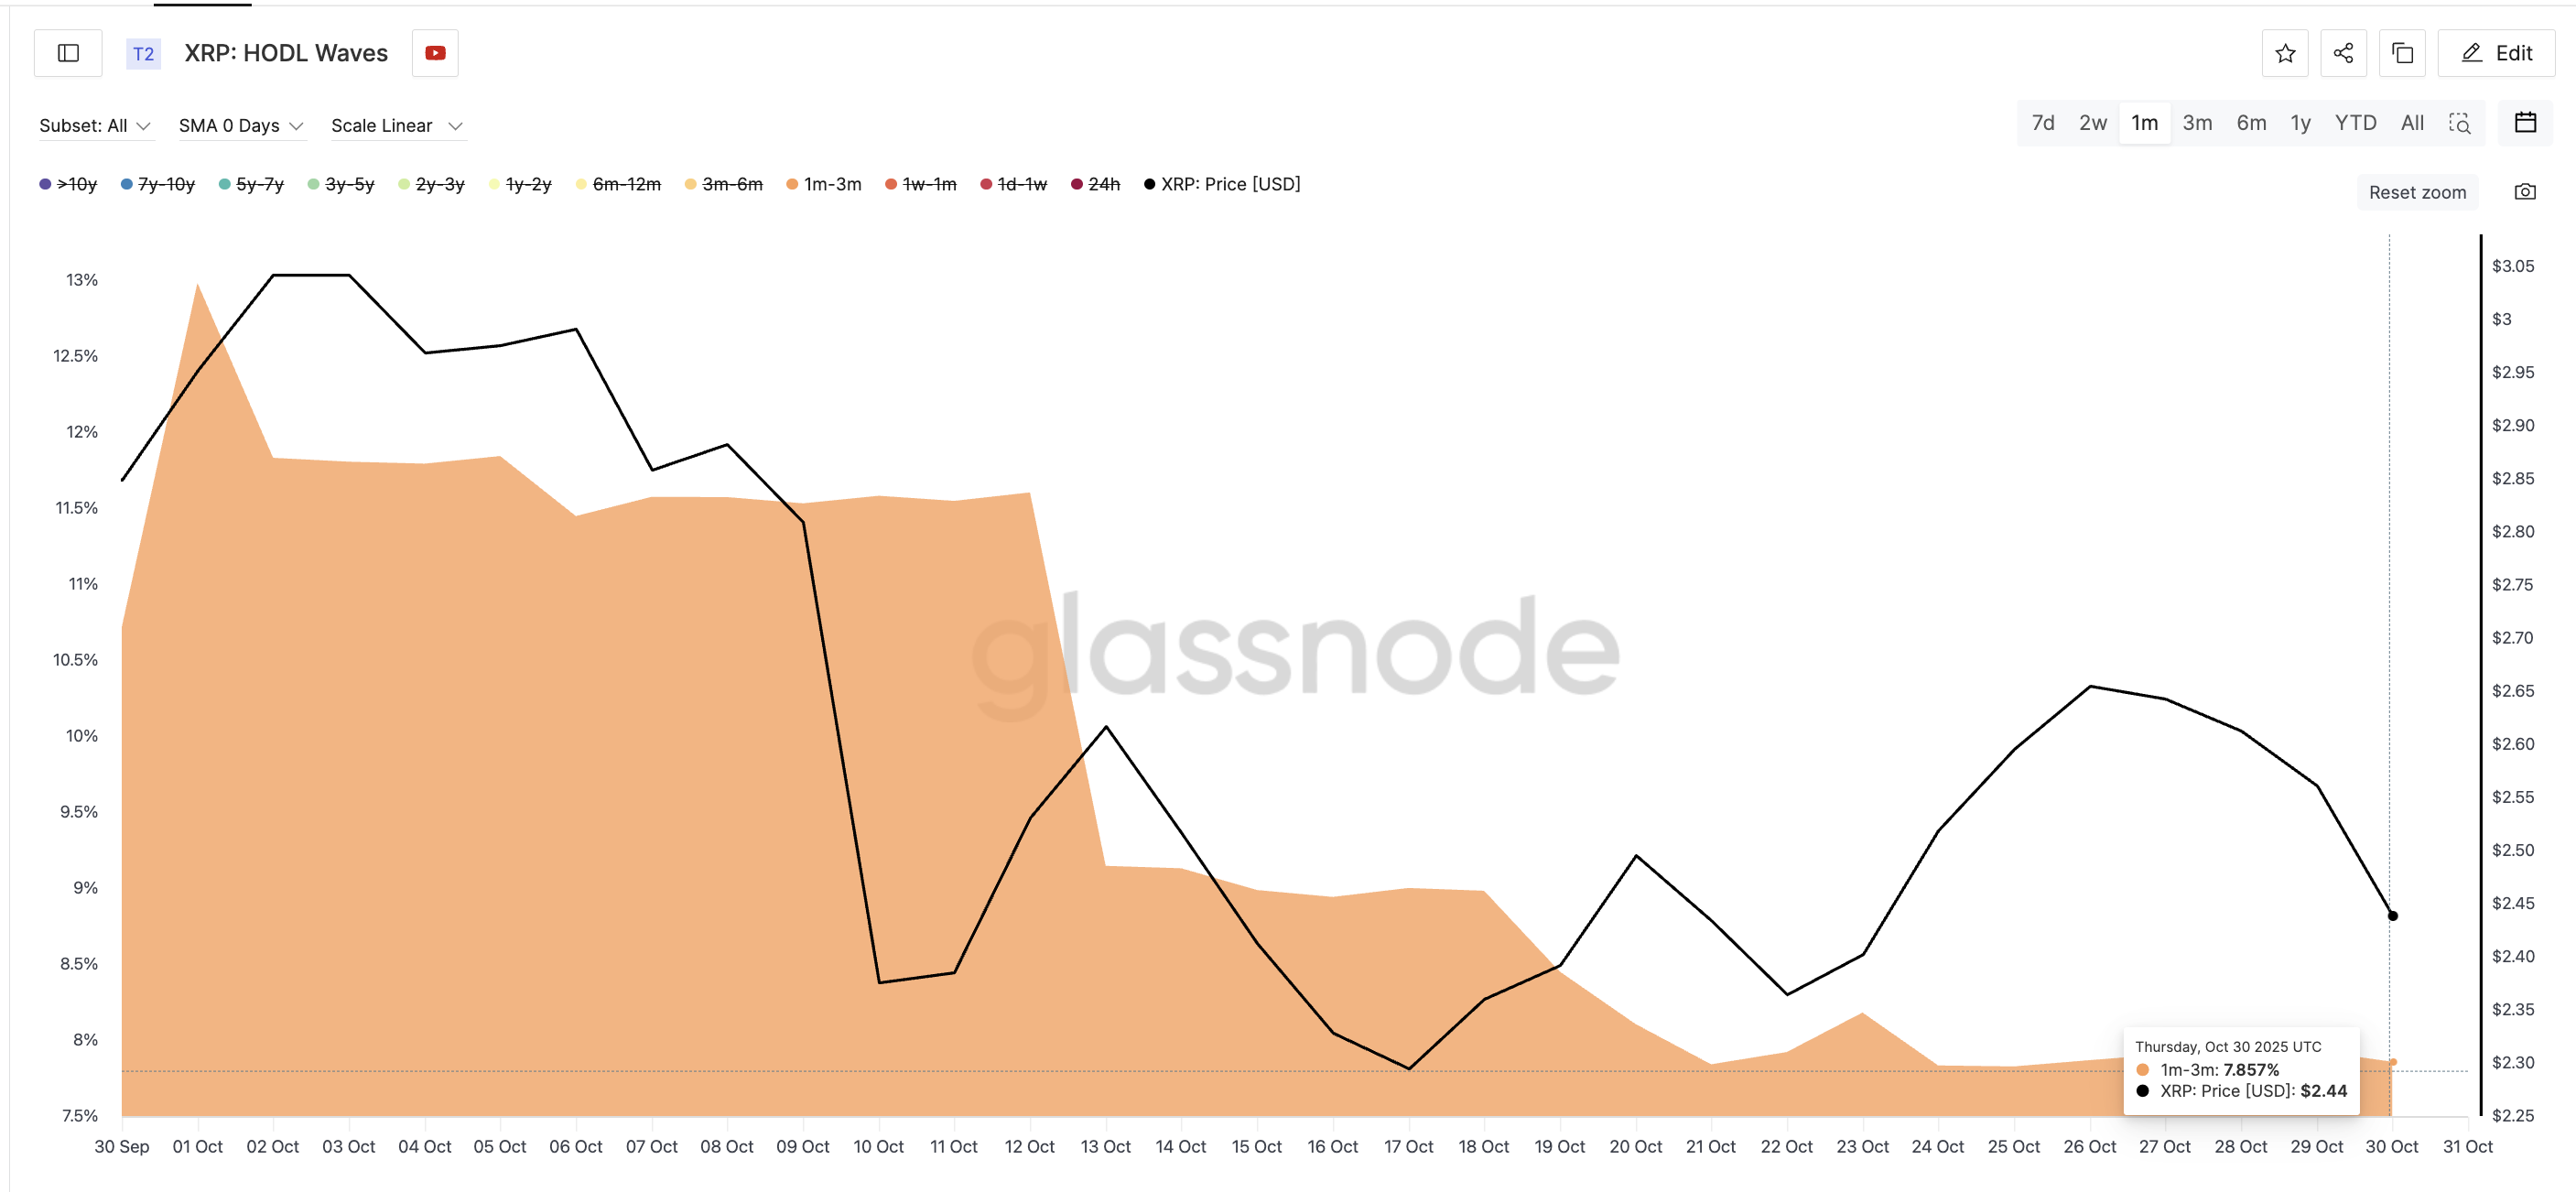 HOLD Waves Reveals Short-Term Sellers: Glassnode
Interestingly, November has historically been XRP’s strongest month, with an average gain of +88% and a median rise of +25%.
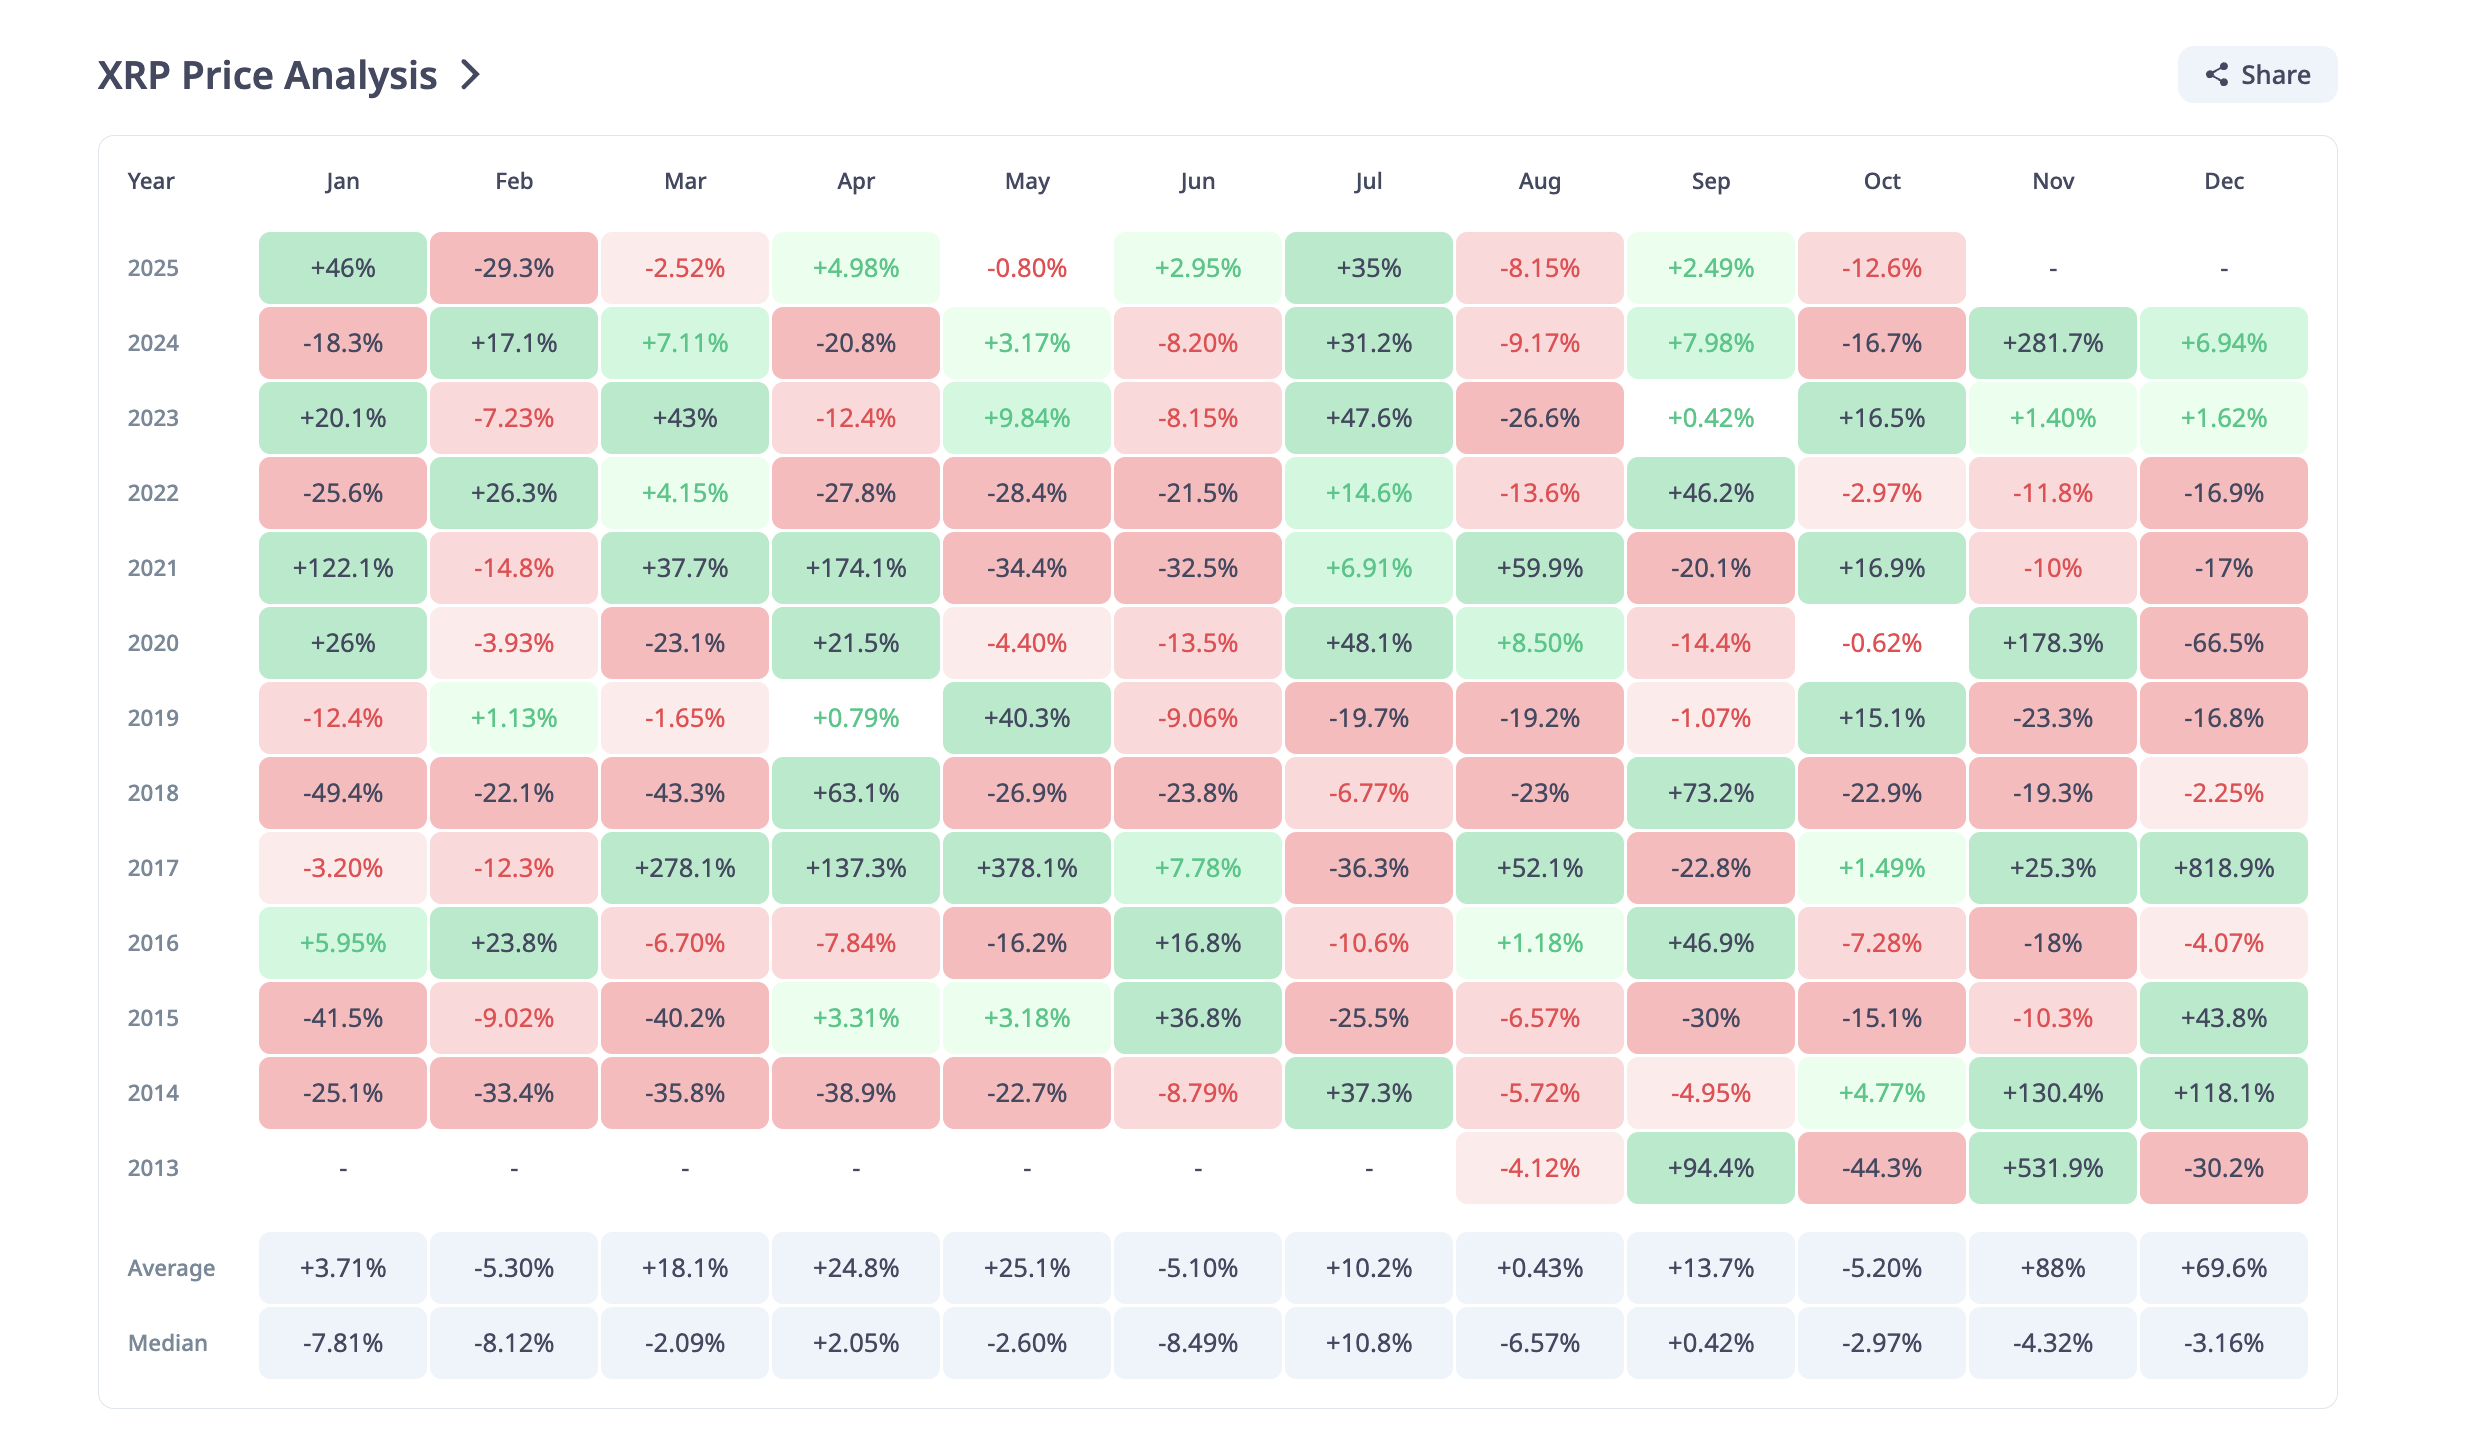 XRP Price History: CryptoRank
But that strength often depended on accumulation by these same cohorts. Their current selling pressure, therefore, limits the chances of a repeat performance this year — unless whales step in to fill the gap.
Whales Are Quietly Accumulating Ahead of November
While smaller investors have been reducing exposure, large wallet addresses have been quietly accumulating.
Whales holding between 100 million and 1 billion XRP have added significantly to their holdings over the past two weeks. Their combined stash rose from 6.97 billion XRP on October 16 to 8.24 billion XRP on October 31 — an increase of 1.27 billion XRP, worth about $3.15 billion at the current price of $2.48.
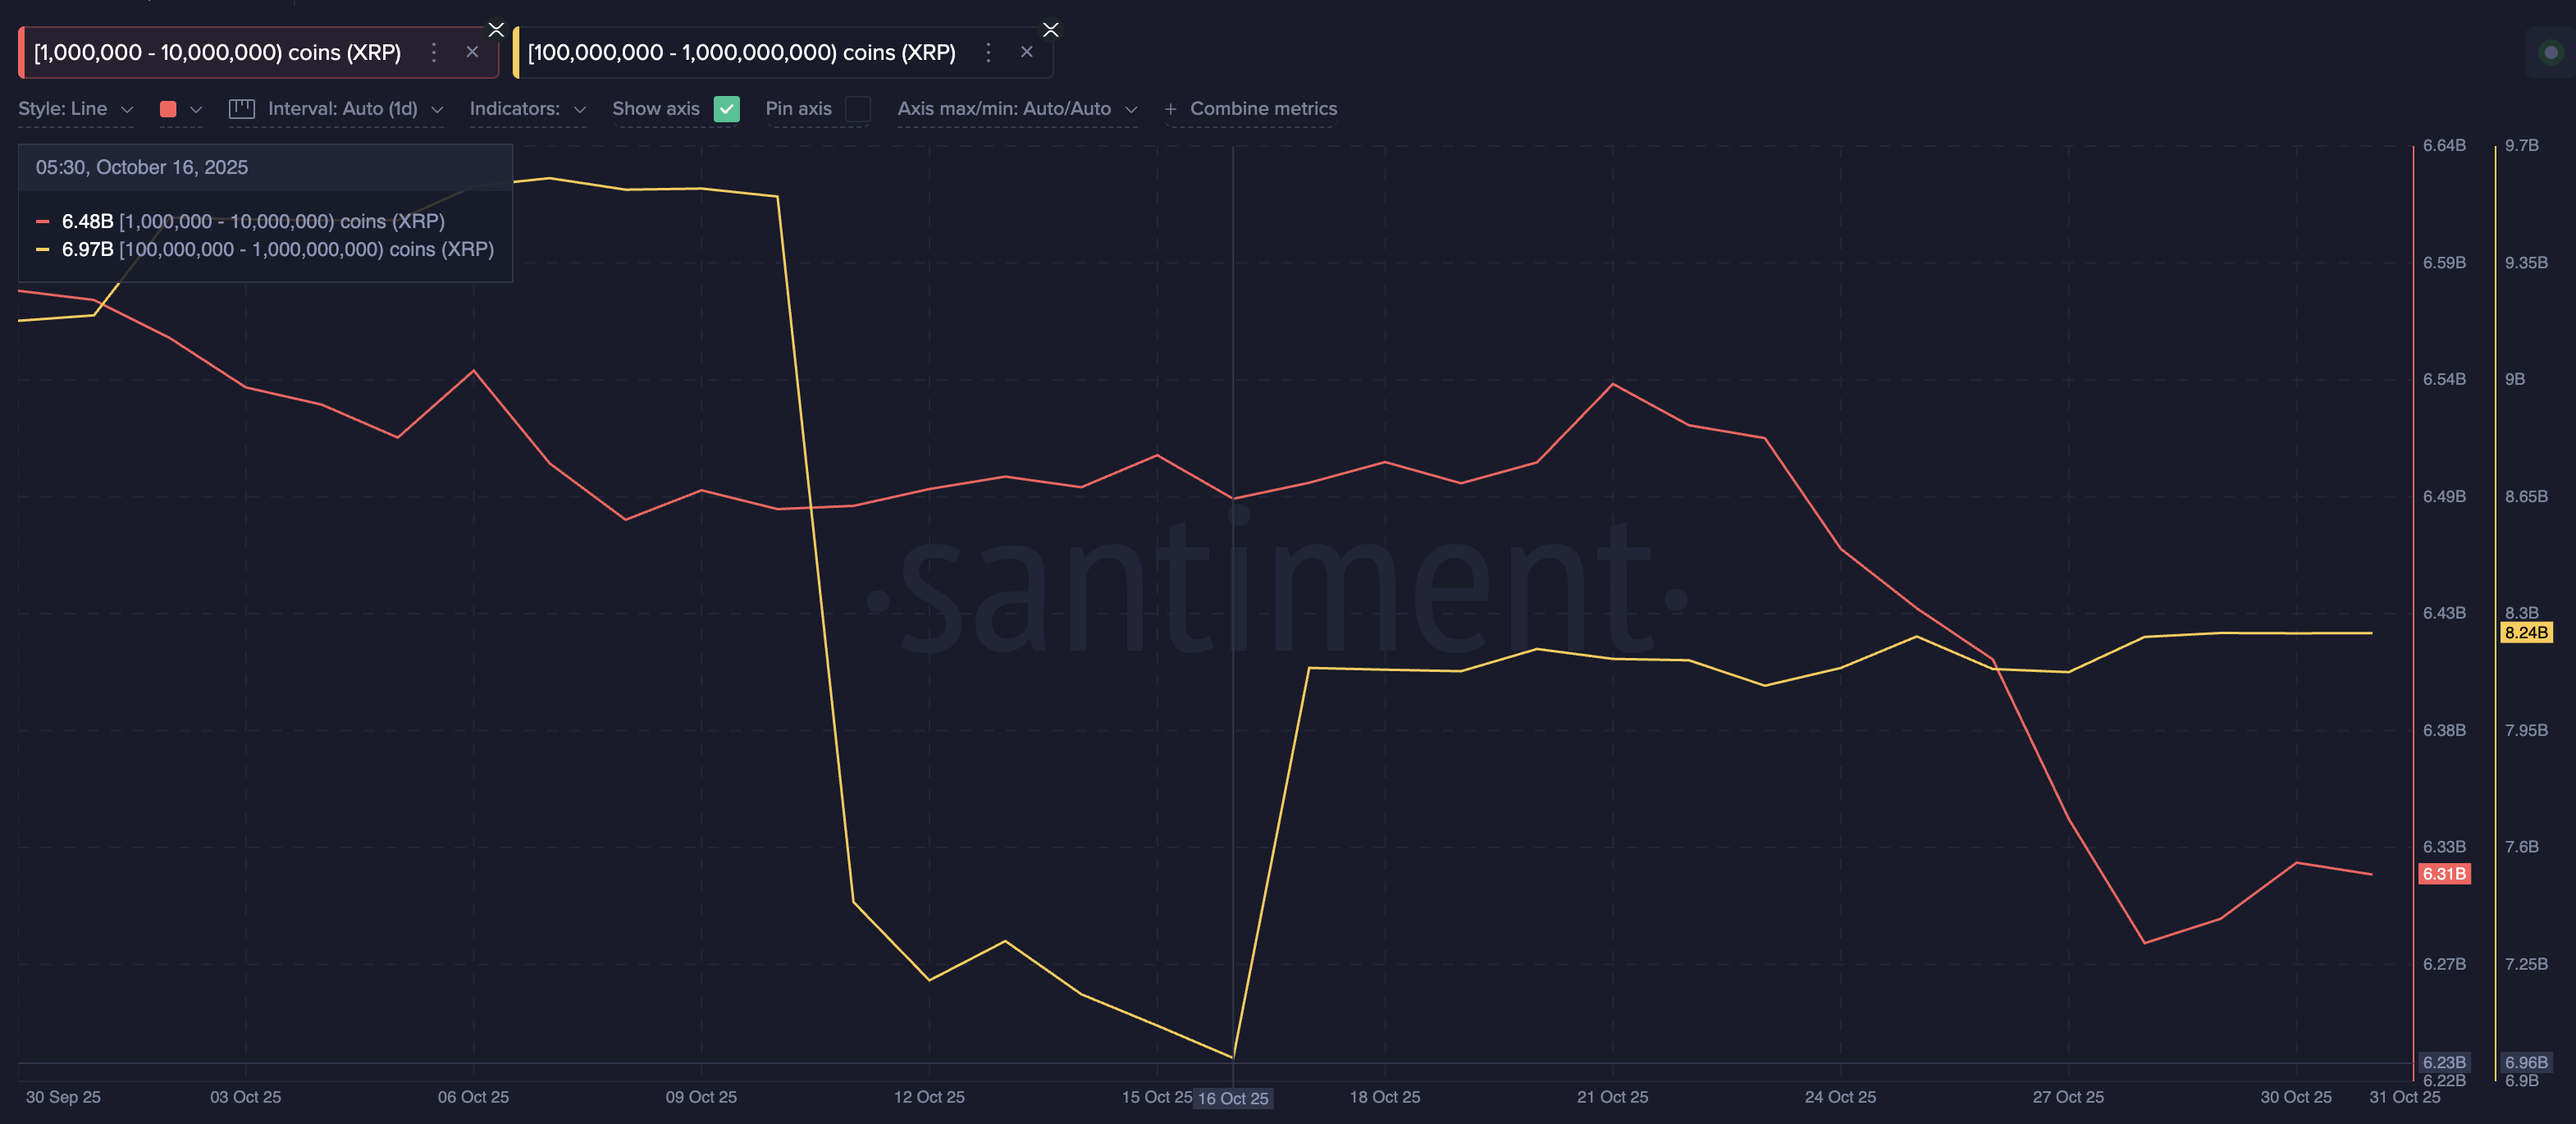 XRP Whales In Action: Santiment
This contrasts with mid-tier whales holding 1 million to 10 million XRP, who were net sellers for most of October. But the tide may be shifting. Between October 28 and 30, their balances grew from 6.28 billion to 6.31 billion, adding about 30 million XRP worth roughly $74 million.
This rebound in mid-sized whale accumulation often signals early stabilization — a key precursor to any sustainable rally.
Maria Carola, CEO of StealthEx, believes this shift shows a more mature market structure. In doing so, she also revealed a few key levels where accumulation clusters might form:
“The current XRP market structure reflects a maturing dynamic characterized by measured accumulation and disciplined exposure. A strong support base has formed around the $2.60–$2.63 range — a key pivot zone that will determine near-term direction,” she mentioned.
It would also be interesting to see if, in November, these willing whales can offset the cohort-specific sell pressure.
Supply Zones, XRP Price Levels, and What Could Drive the Next Move
The cost-basis distribution heatmap, which shows where most tokens were last bought, highlights two heavy supply zones standing in the way of XRP.
The first sits near $2.52–$2.54, where approximately 1.23 billion XRP have been accumulated. This explains why XRP has repeatedly failed to hold above $2.59.
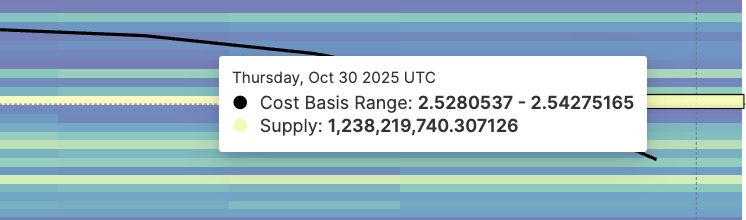 Nearest Support Level Faces Supply Pressure: Glassnode
The second, stronger wall lies between $2.80 and $2.82, where approximately 1.88 billion XRP have been purchased. That key zone will determine if the XRP price can break into a sustained uptrend.
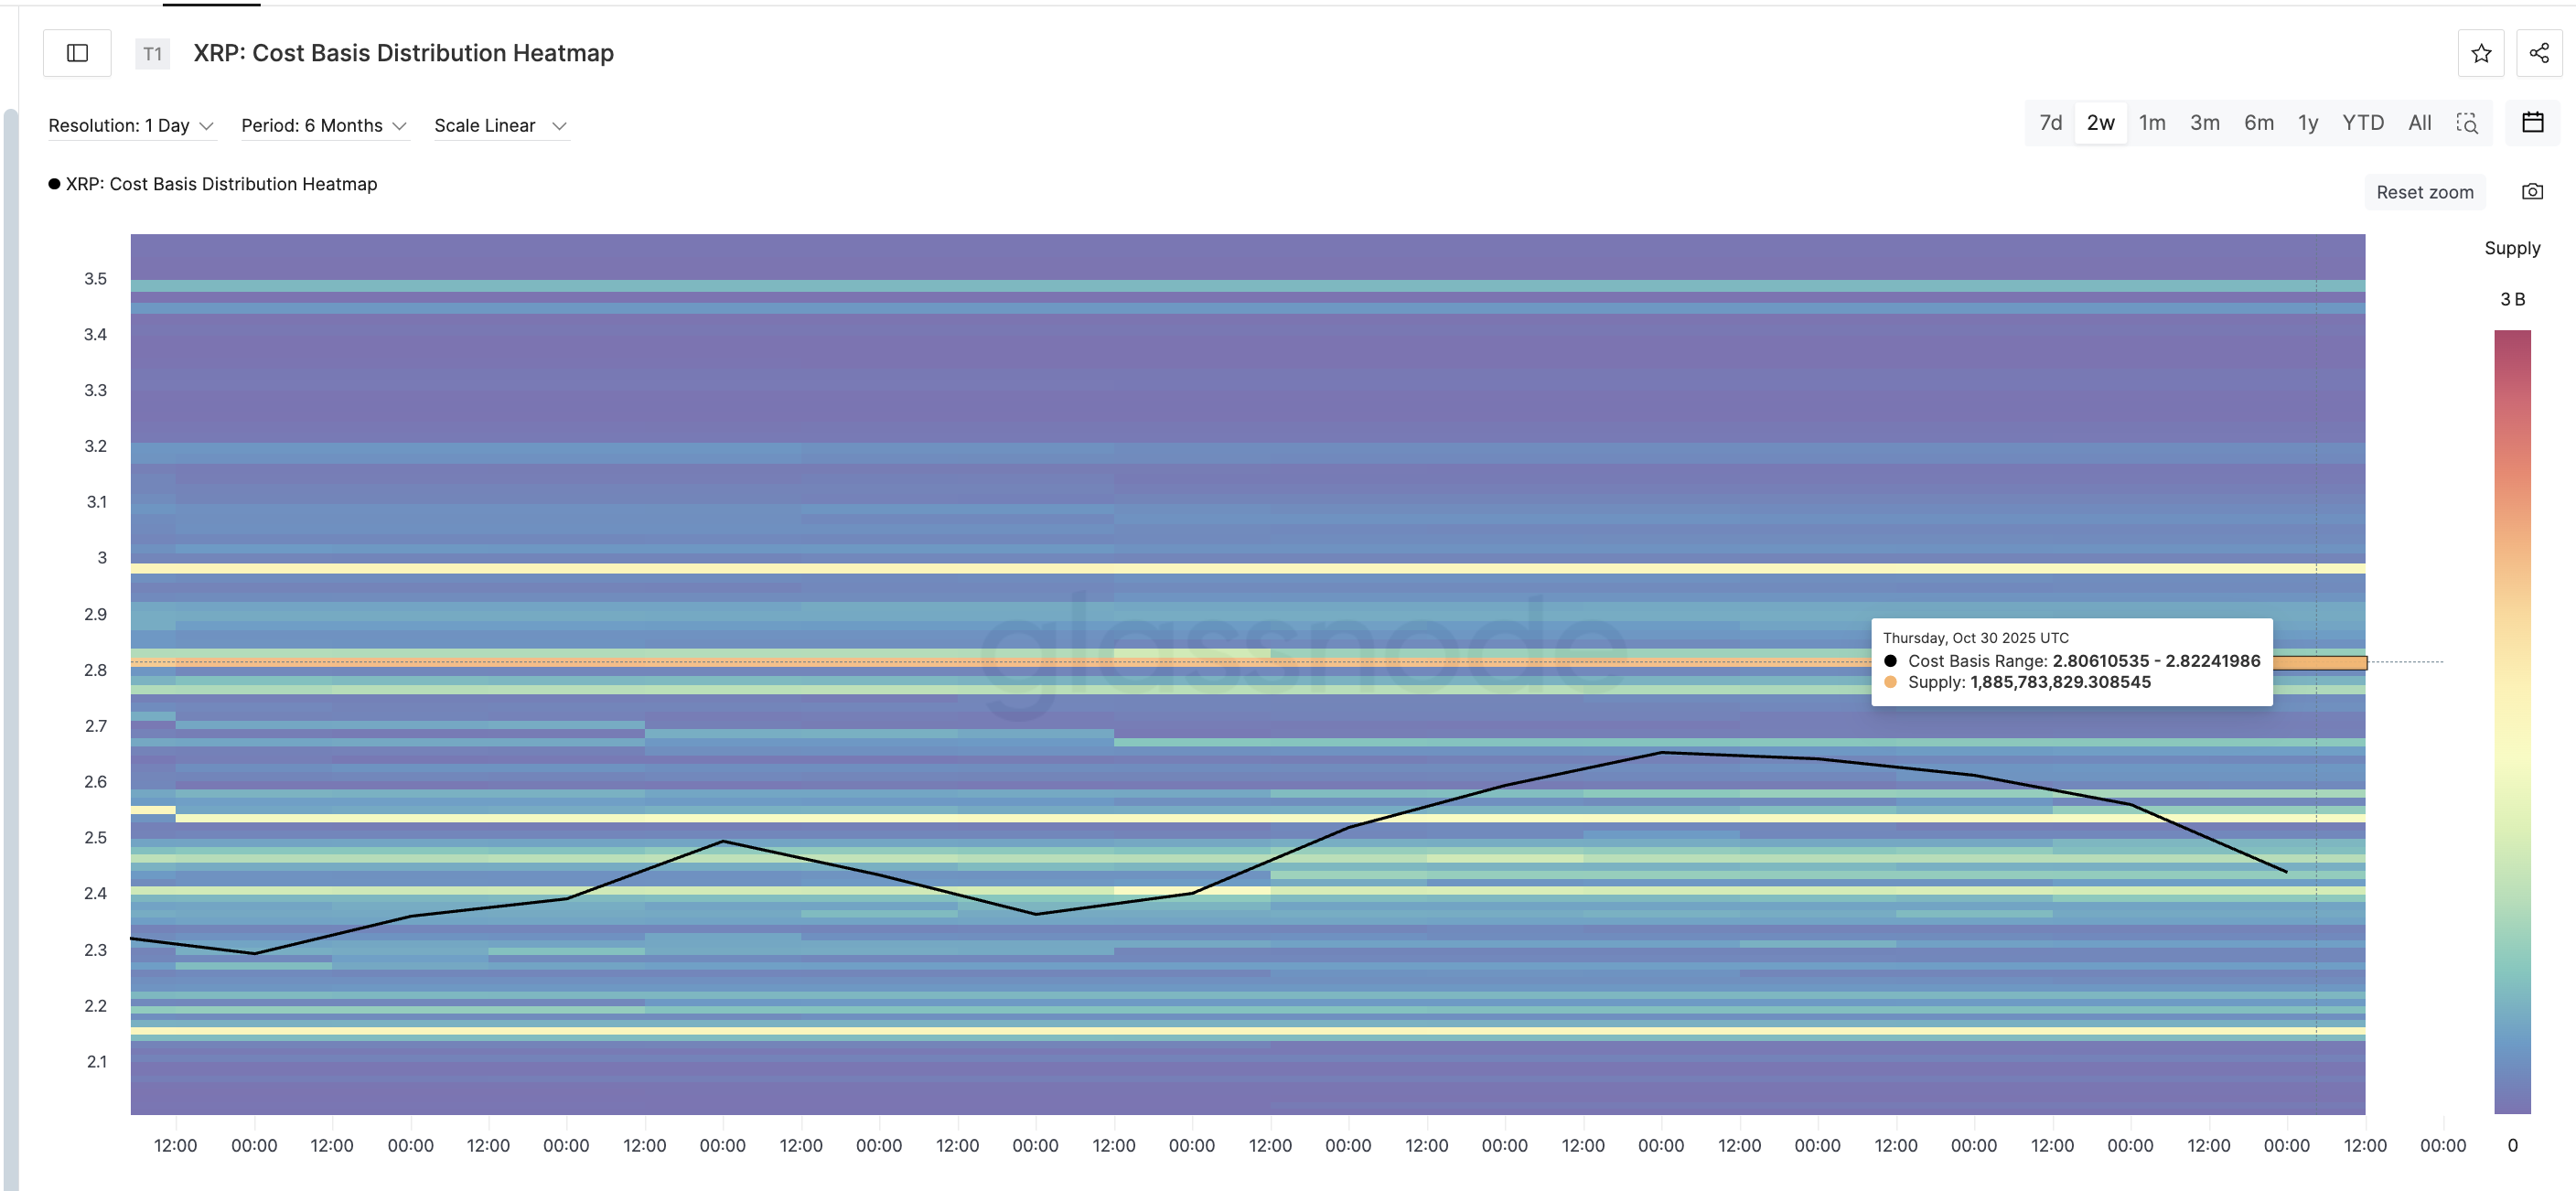 XRP Heatmap And Key Levels: Glassnode
At the same time, the 2-day price chart shows XRP consolidating within a symmetrical triangle pattern. That reflects a tug-of-war between buyers and sellers. The lower trendline has only two touch points, making it relatively weak, increasing the chance of a short-term downside move if selling resumes.
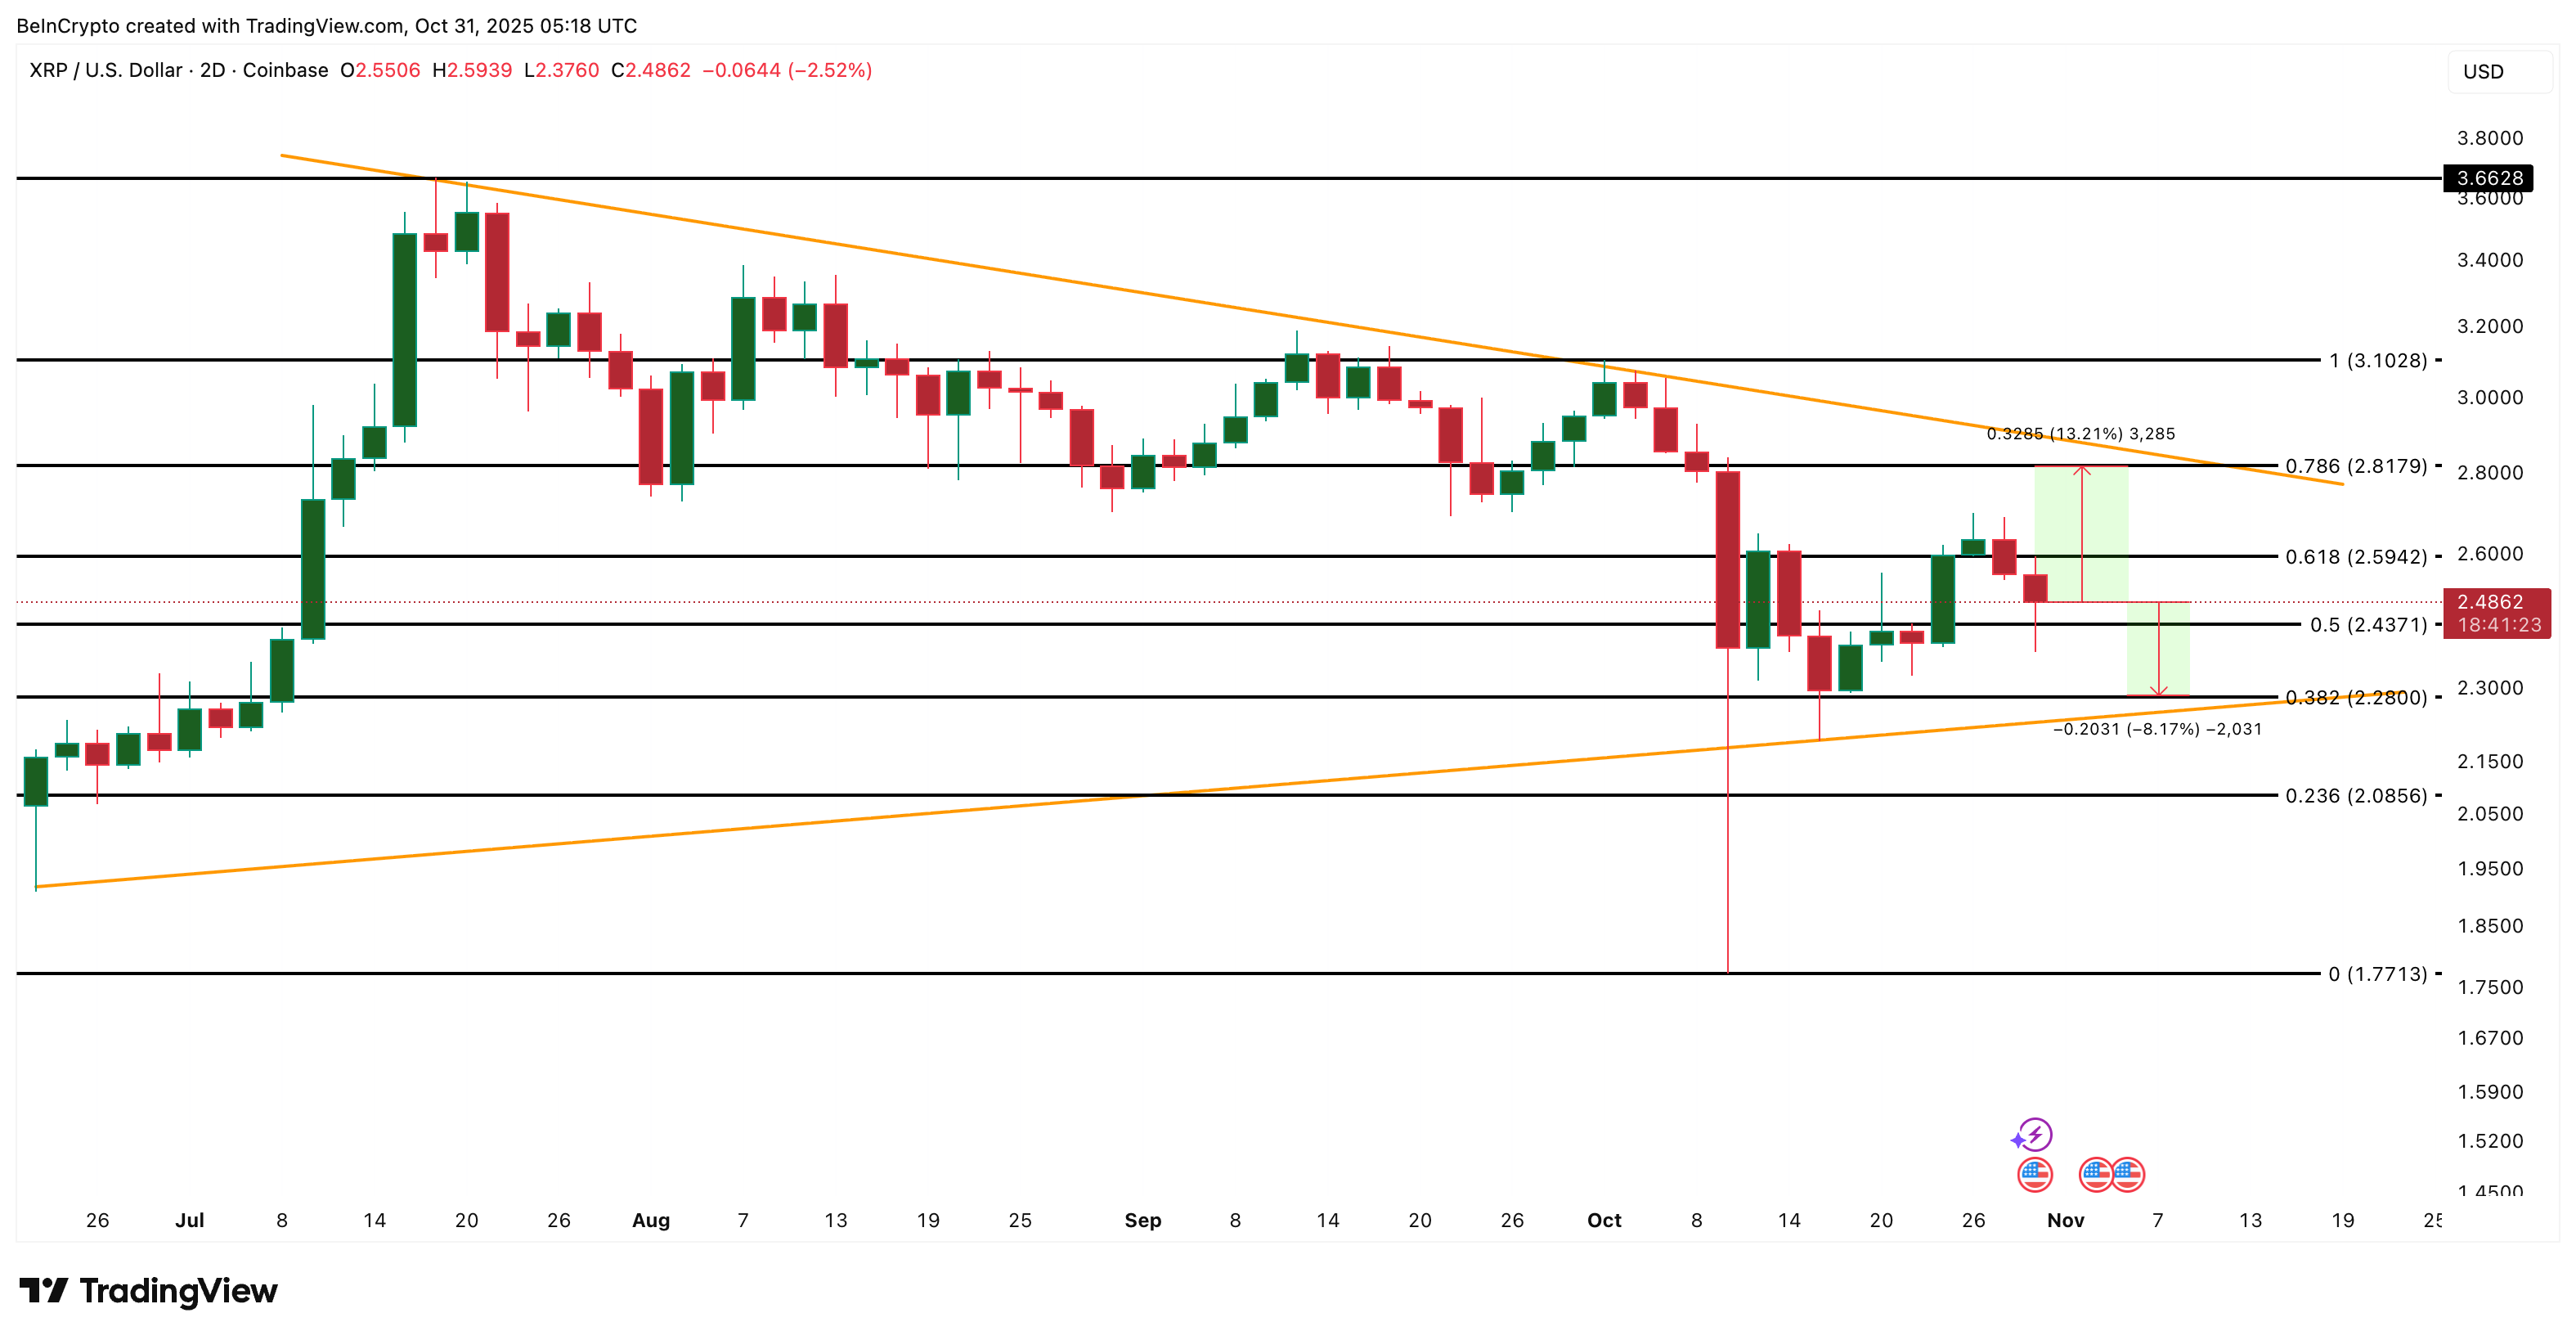 XRP Price Analysis: TradingView
Maria Carola adds perspective and adds more weight to our previously mentioned XRP price level of $2.59:
“As long as XRP holds above $2.60, the direction with less resistance remains to the upside. If it breaks above $2.67–$2.70, supported by renewed capital rotation, it could even retest $3 should macro tailwinds emerge,” she said.
A breakout above $2.81 (confirmed by the heatmap) would further strengthen the bullish case. That could possibly push the price to $3.10 and even $3.66. On the downside, a drop below $2.28 could a decline toward the $2.08 region.
However, the selling wave(s) and the weakness of the lower trendline make a dip likely if market conditions worsen. And that would extend the XRP price correction before any recovery attempt.
The post What To Expect From XRP Price In November 2025 appeared first on BeInCrypto.


 24h Most Popular


 Utilities