

The ongoing double-bottom retest on the monthly chart mirrors historic pre-rally setups seen in past XRP market cycles. With volume climbing and ETF inflows expected, analysts argue that holding this zone could trigger upside continuation toward $5 and beyond.
XRP Tests the 20-Month EMA—A Historically Pivotal Level
Technical analysts note that XRP’s price is currently testing its 20-month Exponential Moving Average (EMA) near $1.90 on the monthly timeframe. This long-term moving average has historically acted as a directional indicator for XRP’s macro trend.
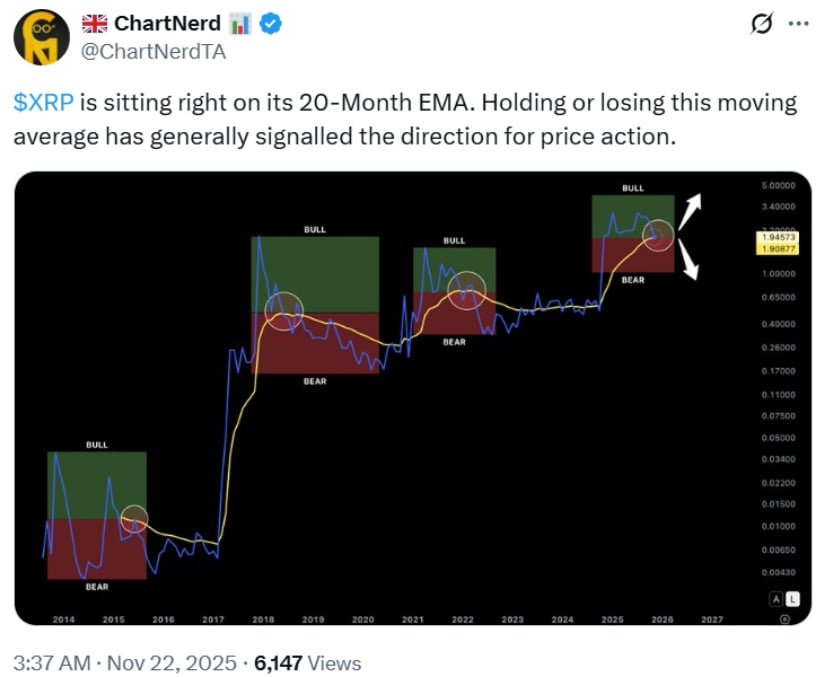
XRP sits on its crucial 20-month EMA, a make-or-break level that often determines its next major price direction. Source: @ChartNerdTA via X
Independent technical analyst ChartNerd, known for long-range trend modelling, commented on X that “Holding or losing this moving average has generally signalled the direction for price action.”
Historical behavior supports this framework. Based on publicly available monthly XRP chart data:
-
In 2017, XRP’s sustained hold above the 20-month EMA preceded its rally toward the former XRP all-time high near $3.40.
-
Breaks below the same EMA in 2018 and 2020 coincided with extended corrective phases lasting multiple quarters.
As of November 22, XRP trades near $1.95, and analysts suggest that maintaining support on the monthly EMA may allow the price to attempt a move toward $2.21 on the daily timeframe. However, a confirmed monthly close below the 20-month EMA could expose the XRP coin to a deeper retracement toward $1.75.
Double-Bottom Pattern Signals Long-Term Bullish Structure
Beyond short-term technical levels, several macro analysts highlight a broader multi-year structure that continues to attract market attention.
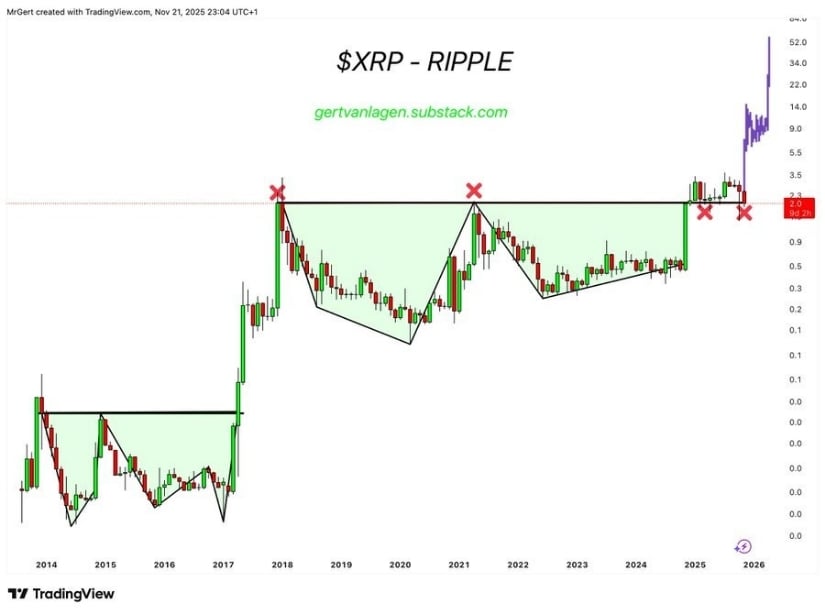
XRP is double-retesting its double-bottom breakout, a key bullish setup that could define its next major move. Source: @GertvanLagen via X
Market cycle analyst Gert van Lagen, who specializes in large-scale pattern identification, noted a “double retest of the double-bottom breakout” on XRP’s monthly chart. The formation began developing between 2021 and 2025, with a key neckline near $1.00. XRP has tested this neckline twice — a characteristic retest often observed in long-term reversal patterns.
Van Lagen compared the structure to a similar pattern that formed from 2014 to 2017, which preceded a significant breakout. His technical measurement model yields a theoretical long-term target near $52, based on classical double-bottom projection principles. However, this projection is contingent on XRP holding the neckline and maintaining sustained monthly closes above breakout levels. Failing those conditions could invalidate the setup and shift focus toward lower supports near $0.90.
For now, XRP is stabilizing around the $2.00 region, and analysts emphasize that multi-year patterns can take considerable time to fully confirm.
ETF Catalyst: Grayscale’s Spot XRP ETF Set to Launch
Momentum surrounding XRP has also been influenced by the upcoming launch of Grayscale’s Spot XRP ETF (GXRP), scheduled to go live on Monday. The ETF, confirmed through SEC filings for the Grayscale XRP Trust, marks a significant step in providing regulated market access to XRP cryptocurrency. Crypto commentator Steph_iscrypto shared documentation confirming the ETF’s status, noting: “GRAYSCALE’S SPOT XRP ETF GOES LIVE MONDAY. XRP TO $5 SEEMS FAIR.”
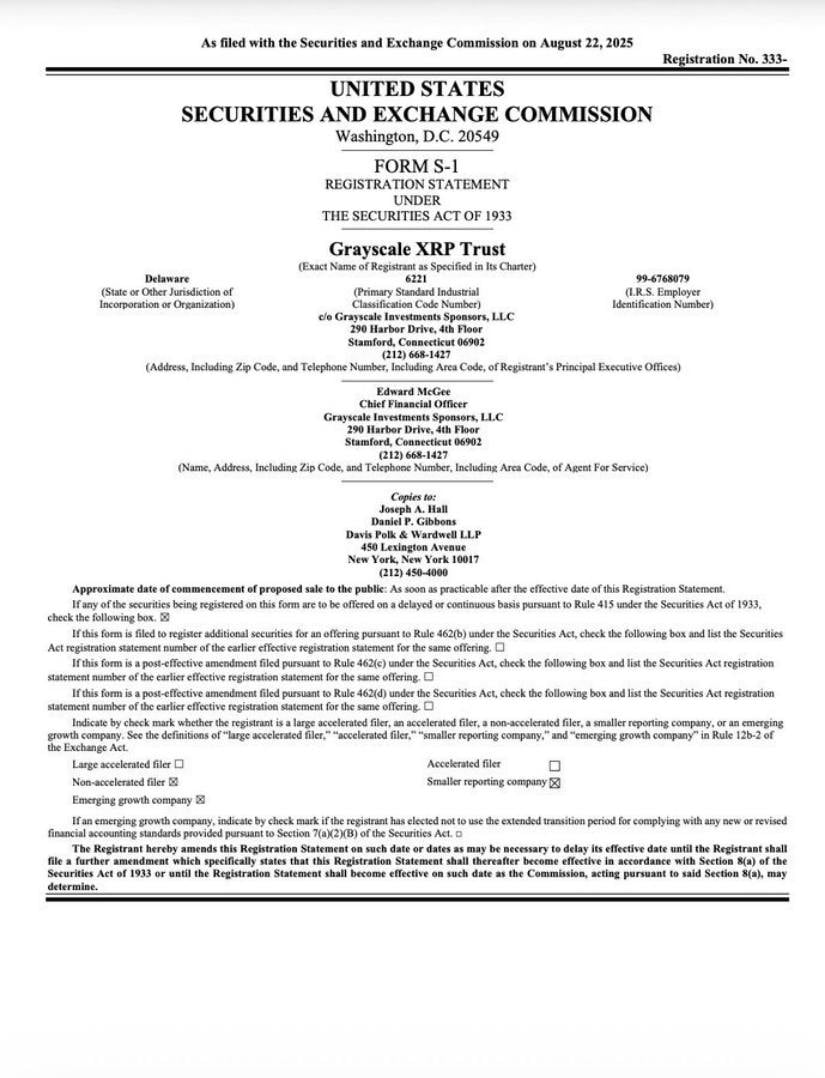
Grayscale’s spot XRP ETF goes live Monday, fueling bullish calls for a run toward $5—buckle up. Source: @Steph_iscrypto via X
This statement reflects a portion of community sentiment, though it does not represent a market-wide consensus forecast. Some analysts argue that while ETF listings tend to improve long-term liquidity and institutional accessibility, they do not guarantee immediate price appreciation, as inflows often develop gradually. Others point to factors such as broader market conditions, regulatory uncertainty, and historical ETF launch behavior across the crypto sector.
Community responses to the ETF news were mixed, with some traders expressing optimism about increased exposure, while others voiced concerns about potential volatility or unrealistic price expectations. Nevertheless, the ETF launch stands as one of the most notable milestones in recent XRP news, following developments in the ongoing Ripple vs. SEC legal narrative.
Market Outlook: Can XRP Hold the $1.90 Level?
With the XRP live price consolidating near the 20-month EMA, market sentiment in the near term depends on whether the asset can defend this historically important support zone on the monthly chart. A stable hold above $1.90 may strengthen the bullish case and allow XRP to retest the $2.21 and $2.50 resistance levels identified on shorter timeframes.
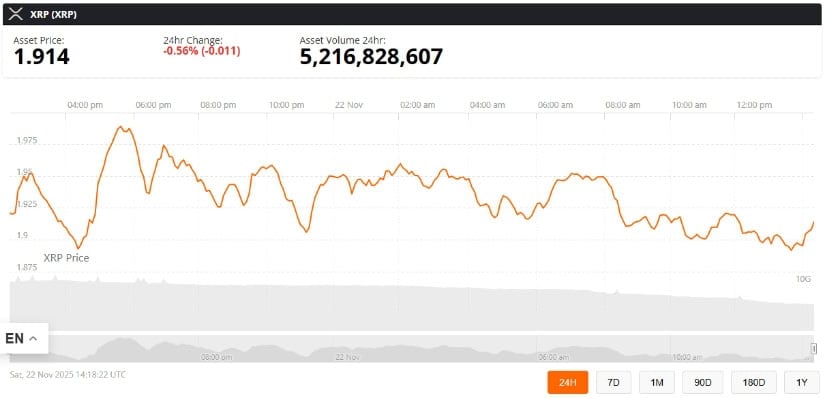
XRP was trading at around 1.91, down 0.56% in the last 24 hours at press time. Source: XRP price via Brave New Coin
The combination of the upcoming ETF launch, long-term structural patterns, and key technical indicators contributes to XRP’s developing outlook. However, analysts continue to caution that volatility is common around major product launches and that reactions to ETF debut flows may take time to stabilize.
For now, XRP remains at a pivotal moment—balancing long-term technical resilience, increasing institutional accessibility, and broader market sentiment as traders assess the next directional move.


 24h Most Popular


 Utilities