
ChainOpera AI’s (COAI ($19.75)) price has rebounded above $19 after a brutal 90% drop between October 12 and 20. The move has renewed some optimism, but the recovery appears fragile. Behind the bounce, several technical and behavioral signals now point to growing exhaustion in the trend.
While the chart still shows a bullish setup, deeper metrics reveal cracks forming beneath the surface — ones that could decide whether COAI’s rebound continues or gives way to another correction.
Divergences Show Buyers Losing Control
The Relative Strength Index (RSI), which tracks buying versus selling strength, is flashing a standard bearish divergence.
Between October 16 and October 24, the COAI price made higher highs, while RSI printed lower highs, hinting that momentum is weakening even as the ChainOpera AI price climbs.
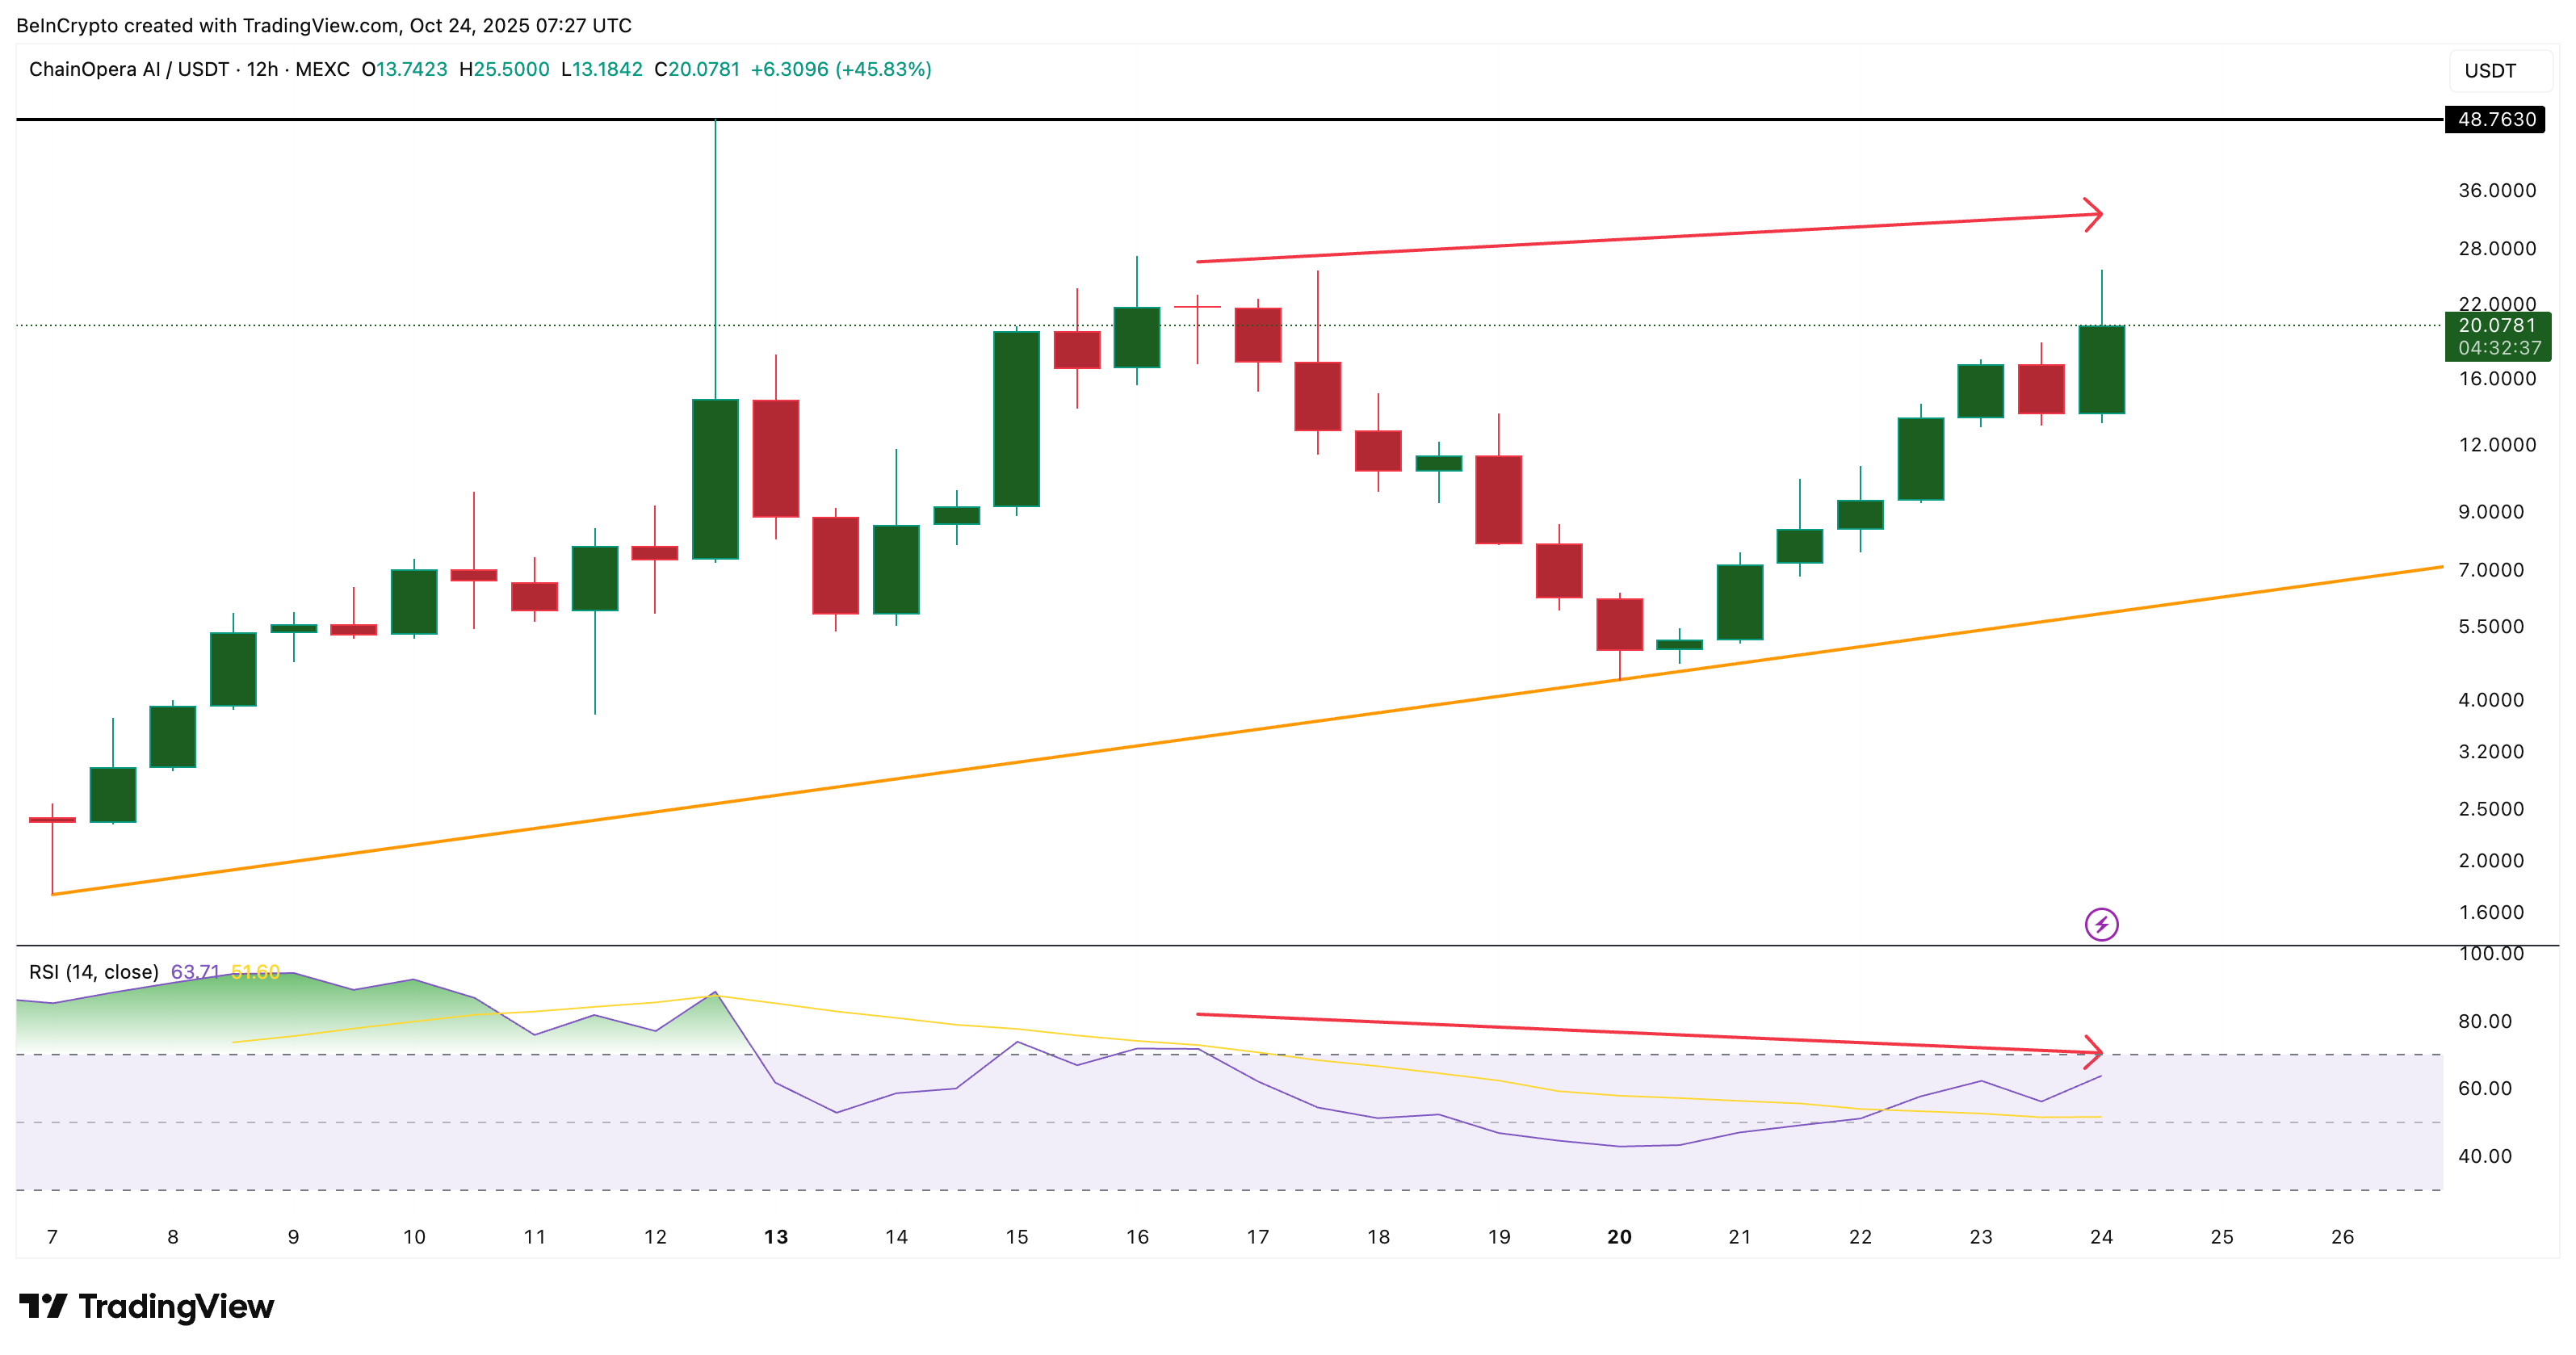 COAI Price And Bearish RSI Divergence: TradingView
Want more token insights like this? Sign up for Editor Harsh Notariya’s Daily Crypto Newsletter here.
The Money Flow Index (MFI), a metric that measures the real flow of money into or out of an asset, confirms that view. Between October 19 and October 23, prices formed higher lows, but MFI made lower lows. This form of bearish divergence signals that inflows are thinning out.
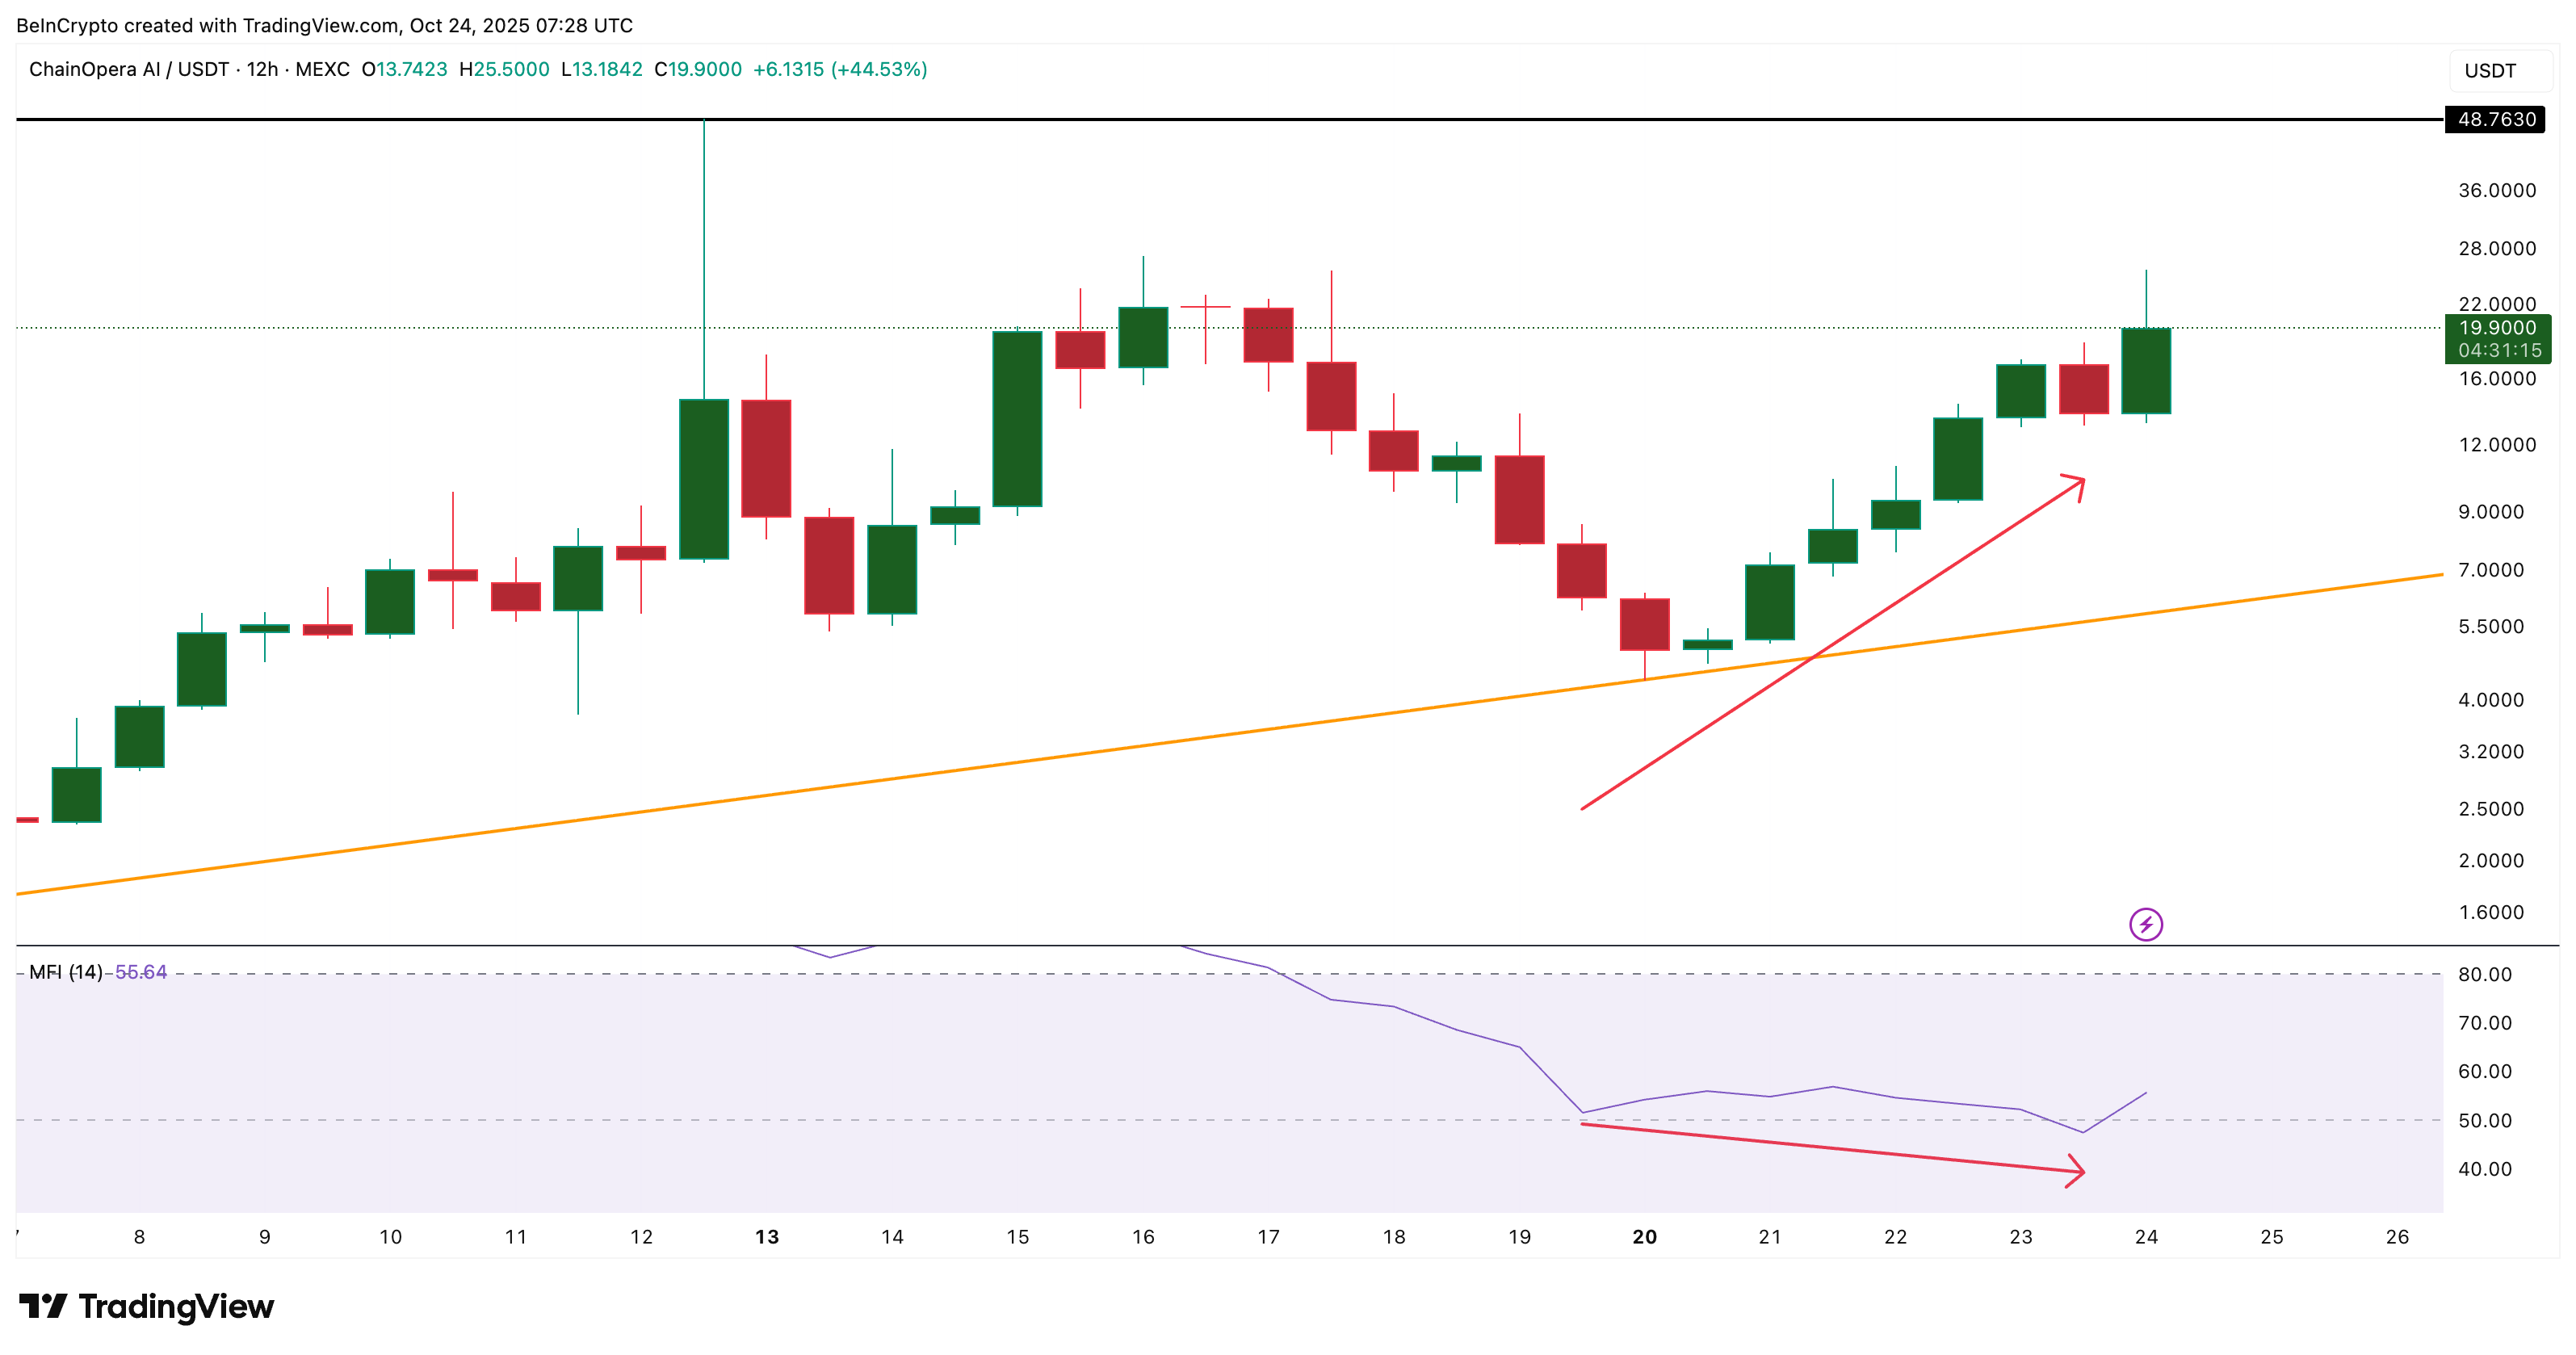 COAI Price And Bearish MFI Divergence: TradingView
When both RSI and MFI diverge from the price, it often marks the early stages of a potential trend reversal. These divergences show that while prices keep rising, buyers are no longer matching previous strength — an early sign that demand may be drying up.
In addition, speculation remains dominant. COAI’s social mentions jumped 1,300% in 24 hours, yet activity appears driven more by hype than sustained demand.
With most COAI supply still concentrated among a few large holders, this mix of momentum loss and speculative trading keeps short-term risk elevated.
Bullish Pattern Intact, but a Break Could Trigger a ChainOpera AI Price Drop
On the 12-hour chart, COAI trades within an ascending (trendline) structure, forming the base of a bullish triangle pattern that traders often associate with continuation. Fibonacci extension levels define the key breakout and support zones within this triangle.
The token faces strong resistance around $22.44, where previous advances stalled. A failure to close above this level could send prices down toward $15.52 and possibly $9.81, implying a near 50% correction from current levels.
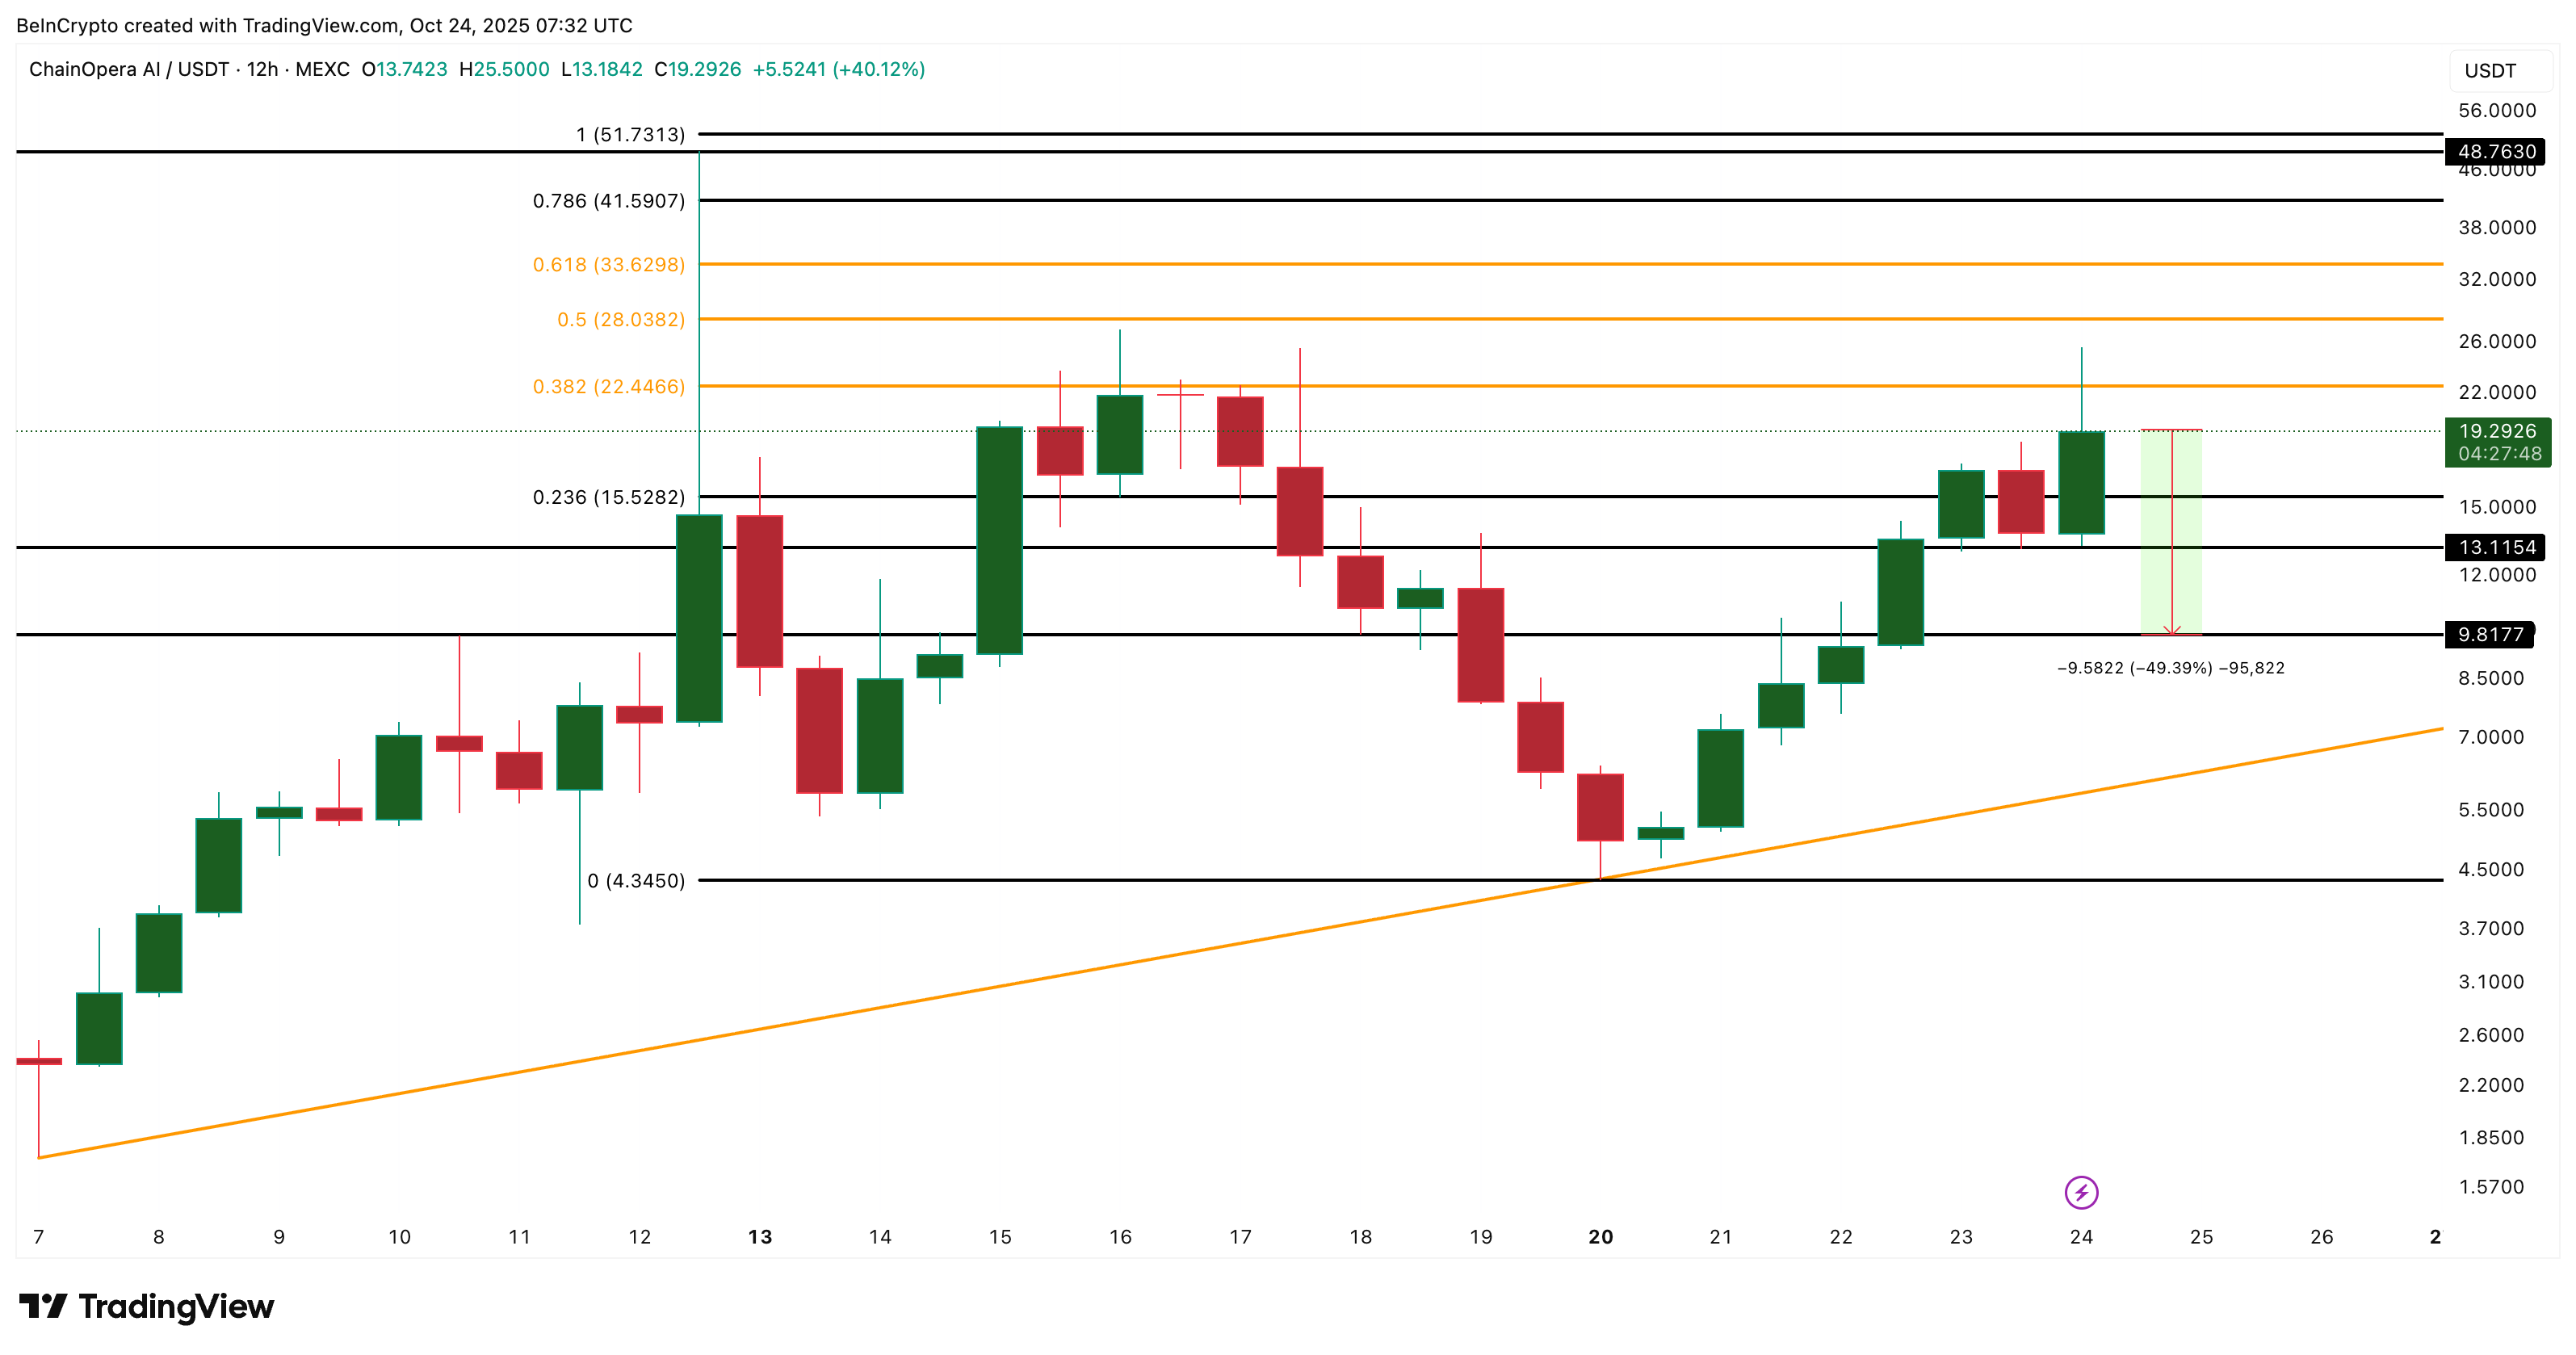 COAI Price Analysis: TradingView
However, a clear breakout above $22.44 (12-hour candle close) would invalidate this bearish setup. That would open room for targets near $28.03 and $33.62.
For now, COAI’s bullish structure remains technically valid. However, the indicators beneath it suggest the rally’s foundation may already be weakening.
The post Bearish ChainOpera AI Metrics Threaten Bullish Setup — Is a 50% Price Dip Coming? appeared first on BeInCrypto.


 24h Most Popular


 Utilities